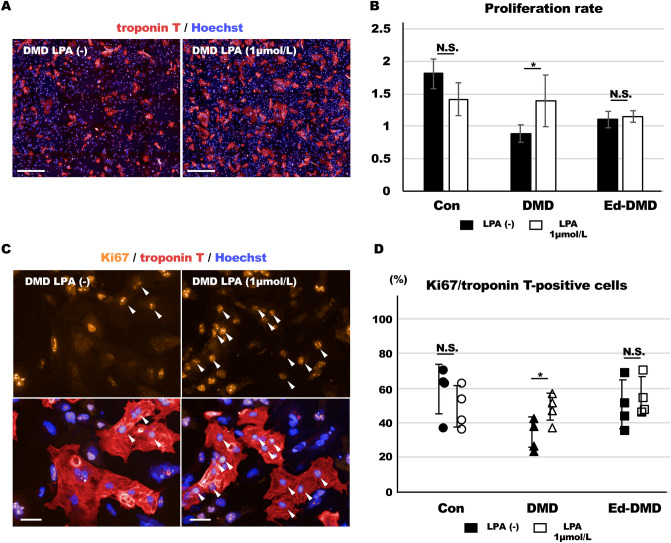
Figure 6.
Proliferative ability of LPA-treated DMD-iPSC-CMs. (A) Troponin T-positive cells was identified using immunofluorescence staining in DMD-iPSC-CMs, not treated and treated with LPA (scale bar 500 µm). (B) Proliferation rate was evaluated in Con-iPSC-CMs, DMD-iPSC-CMs, and Ed-DMD-iPSC-CMs (n = 4 sessions, mean ± SD, *P < 0.05, N.S. not significantly different). (C) Ki67 expression was assessed using immunofluorescence staining in DMD-iPSC-CMs, not treated and treated with LPA. Arrowheads indicate Ki67-positive cells in troponin T-positive cells (scale bar 50 µm). (D) Ratio of Ki67-positive cells in troponin T-positive cells was evaluated in Con-iPSC-CMs, DMD-iPSC-CMs, and Ed-DMD-iPSC-CMs, not treated and treated with LPA (n = 4 sessions, mean analyzed troponin T-positive cell number = 2924 ± 1155, 2454 ± 339, and 2666 ± 2110 cells, respectively, mean ± SD, *P < 0.05, N.S. not significantly different).

