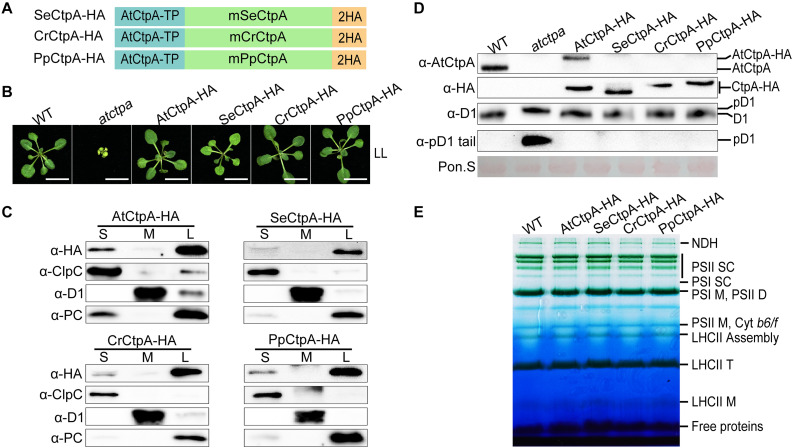
FIGURE 3.
Ectopic expression of CtpA from lower photosynthetic organisms in the atctpa mutant. (A) Schematic diagrams of fusion proteins SeCtpA-HA (from Synechococcus elongatus), CrCtpA-HA (from Chlamydomonas reinhardtii), and PpCtpA-HA (from Physcomitrella patens). AtCtpA-TP is the chloroplast TP of AtCtpA protein; mPpCtpA, mCrCtpA, and mSeCtpA are the mature proteins; 2HA indicates a double hemagglutinin tag. (B) Phenotype of atctpa plants transformed with CaMV 35S promoter-driven SeCtpA-HA, CrCtpA-HA, and PpCtpA-HA. Plants were grown on 1/2 MS medium with 1% sucrose under continuous LL light (25 μmol/s/m2) for 3 weeks. At least five transgenic lines per construct were examined. Scale bars represent 1 cm. (C) Chloroplast sub-compartment distribution of AtCtpA, SeCtpA, CrCtpA, and PpCtpA. Intact chloroplasts from transgenic plants expressing AtCtpA-HA, SeCtpA-HA, CrCtpA-HA, and PpCtpA-HA were fractionated into stroma (S), thylakoid membrane (M), and thylakoid lumen (L). The distribution of CtpA in the three fractions was examined by immunoblotting with a-HA and compared with the thylakoid lumen protein PC, the thylakoid membrane protein D1, and the stromal protein ClpC. (D) D1 processing status in atctpa plants transformed with CaMV 35S promoter-driven SeCtpA-HA, CrCtpA-HA, and PpCtpA-HA. D1 processing in plants in panel (B) was analyzed by immunoblotting using the following antibodies: α-AtCtpA for AtCtpA, α-HA for ectopically expressed CtpA-HA, α-D1 for D1 and pD1, and α-pD1 tail for pD1. The filters stained with Ponceau S (Pon. S) were used as loading control. (E) BN-PAGE analyses of atctpa plants transformed with CaMV 35S promoter-driven SeCtpA-HA, CrCtpA-HA, and PpCtpA-HA. The transgenic and WT plants were grown in soil under continuous NL light (80 μmol/s/m2) for 3 weeks before analyses. Thylakoid membrane protein complexes (12 μg chlorophyll) were loaded on a BN-PAGE gel for electrophoresis.

