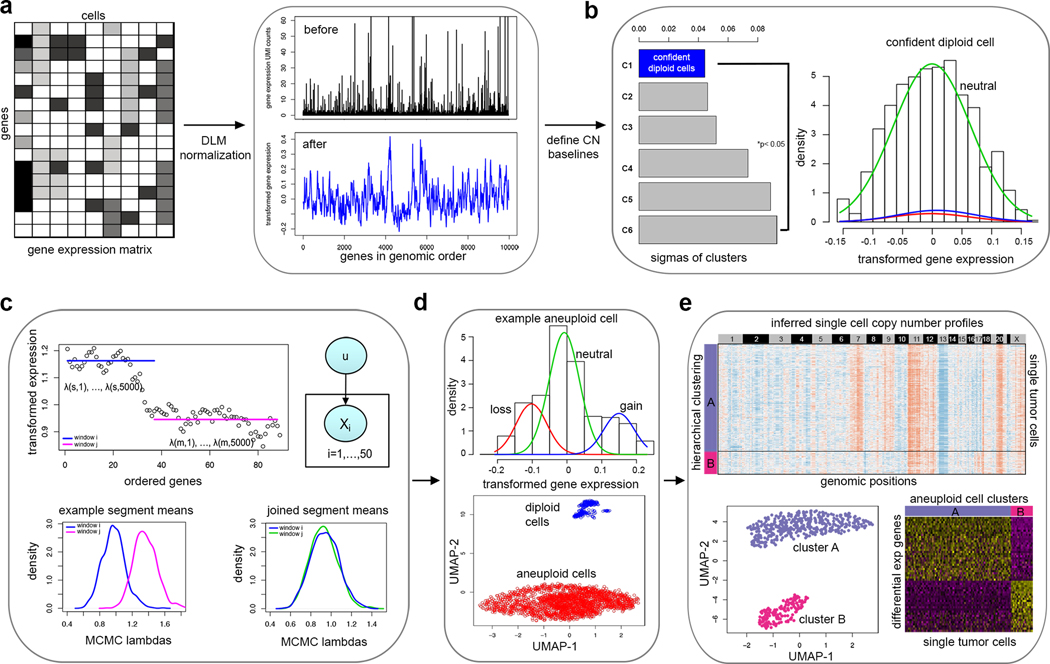
Figure 1 – Overview of the CopyKAT analysis workflow.
a, The CopyKAT workflow begins with a UMI count matrix to order genes by their genomic positions and uses the raw count matrix to perform log-Freeman Turkey Transformation to stabilize variance and smooth outliers using a polynomial dynamic linear model. b, A subset of normal cells is defined using integrative clustering and GMM method to infer the copy number baseline. c, Relative gene expression values in single cells are used for MCMC segmentation and segments are merged by KS testing. d, Aneuploid tumor and normal cell clusters are classified using a normal cell enrichment and GMM distribution tests. e, Clonal substructure of tumor cells are delineated by clustering and subclones are used for differential expression analysis.

