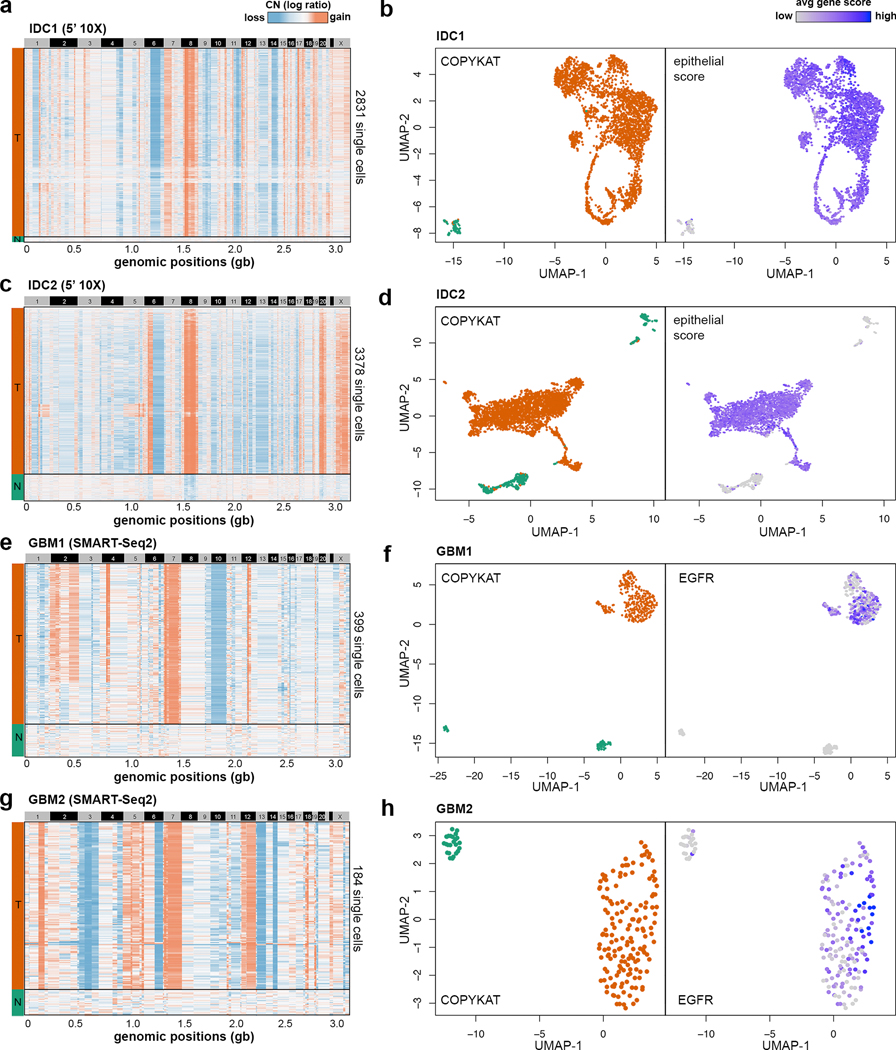
Figure 4 – Classification of tumor and normal cells sequenced by different scRNA-seq technologies.
Clustered heatmaps of single cell copy number profiles estimated by CopyKAT from 5’ scRNA-seq data for invasive breast cancer samples (a) IDC1 and (c) IDC2, and full-length SMART-seq2 scRNA-seq data for GBM sample (e) GBM1 and (g) GBM2. CopyKAT classification of diploid normal cells (N) and aneuploid cells tumor cells (T) are indicated on the left side annotation bars. High-dimensional UMAP embedding of scRNA-seq data with annotation of the inferred CopyKAT diploid and aneuploid copy number profiles for (b) IDC1, (d) IDC2, (f) GBM1 and (h) GBM2.

