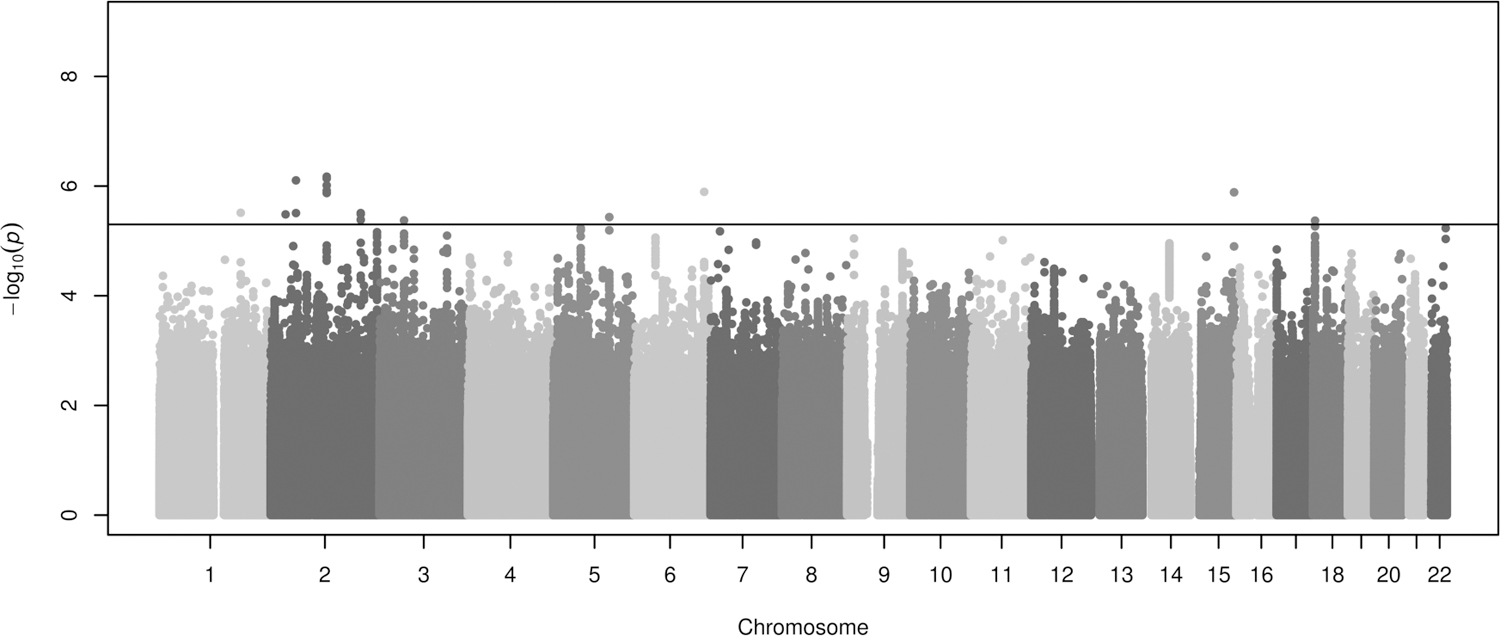
Figure 1. Manhattan plot of association results of asthma exacerbations in ICS users included in the discovery phase.

Association results are represented as -log10 p-value on the y-axis along the chromosomes (x-axis). The horizontal black line shows the suggestive significance threshold for replication (p≤5×10⁻⁶).
