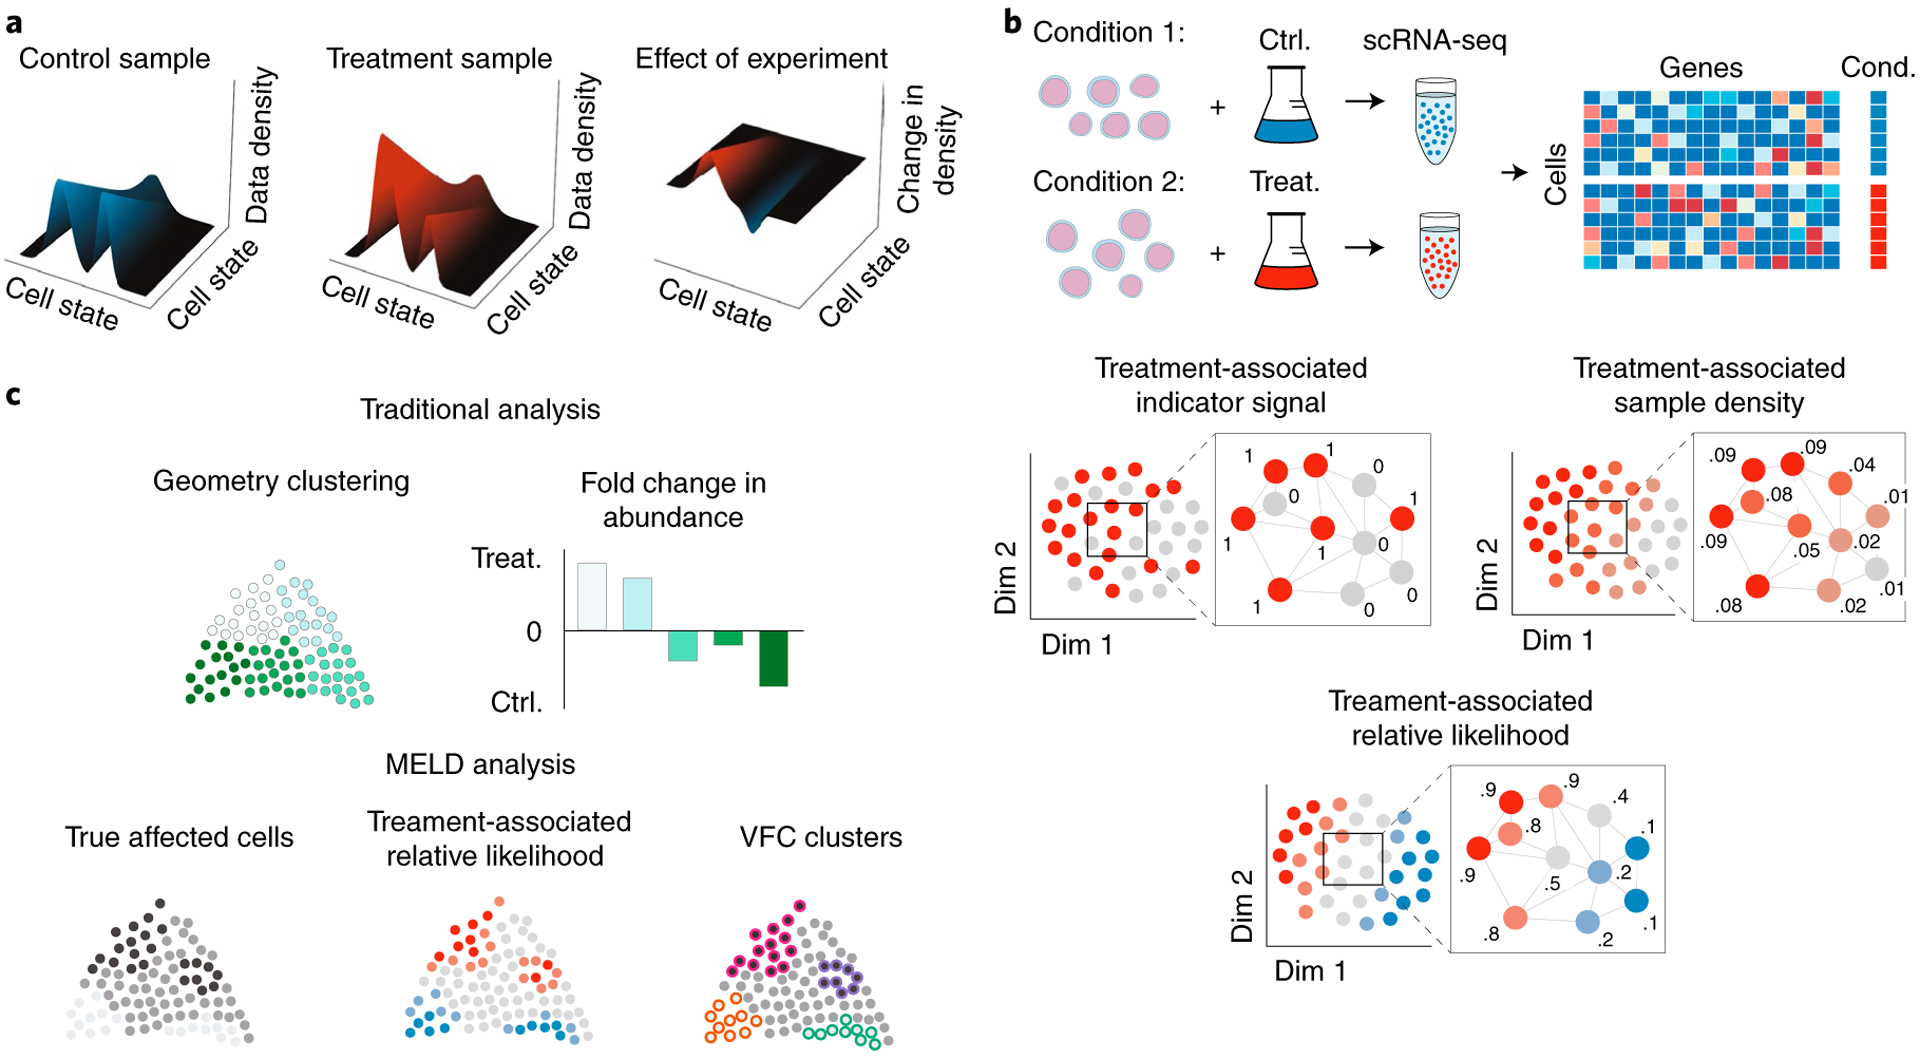
Fig. 1 |. Illustrative description of perturbation analysis using MELD and VFC.

a, To quantify the effect of an experiment, we model single-cell experiments as samples from a probability density function (pdf) over the underlying transcriptomic cell state space manifold. The pdf for the control sample is the frequency with which cell states are observed in the control sample compared to the overall frequency of the cell state in both samples combined. In this context, the effect of an experimental perturbation is to alter this probability density and, thus, the data density in the treatment sample relative to the control. Therefore, the effect of an experimental perturbation can be quantified as the change in the probability density in the experiment condition relative to the control. b, The sample-associated relative likelihood quantifies this effect by computing a kernel density estimate (KDE) over the cell similarity graph using graph signals representing indicator vectors for each sample. The sample-associated relative likelihood indicates the likelihood that a particular cell is from the treatment or control conditions. c, In traditional analysis of scRNA-seq datasets, the clusters are based solely on the data geometry, and changes in abundance between conditions might not align with the true affected populations. Using the sample-associated relative likelihood and VFC, we can identify the correct cluster resolution for downstream analysis.
