
Fig. 2 |. Vertex frequency analysis using the sample-associated indicator signals and relative likelihood.
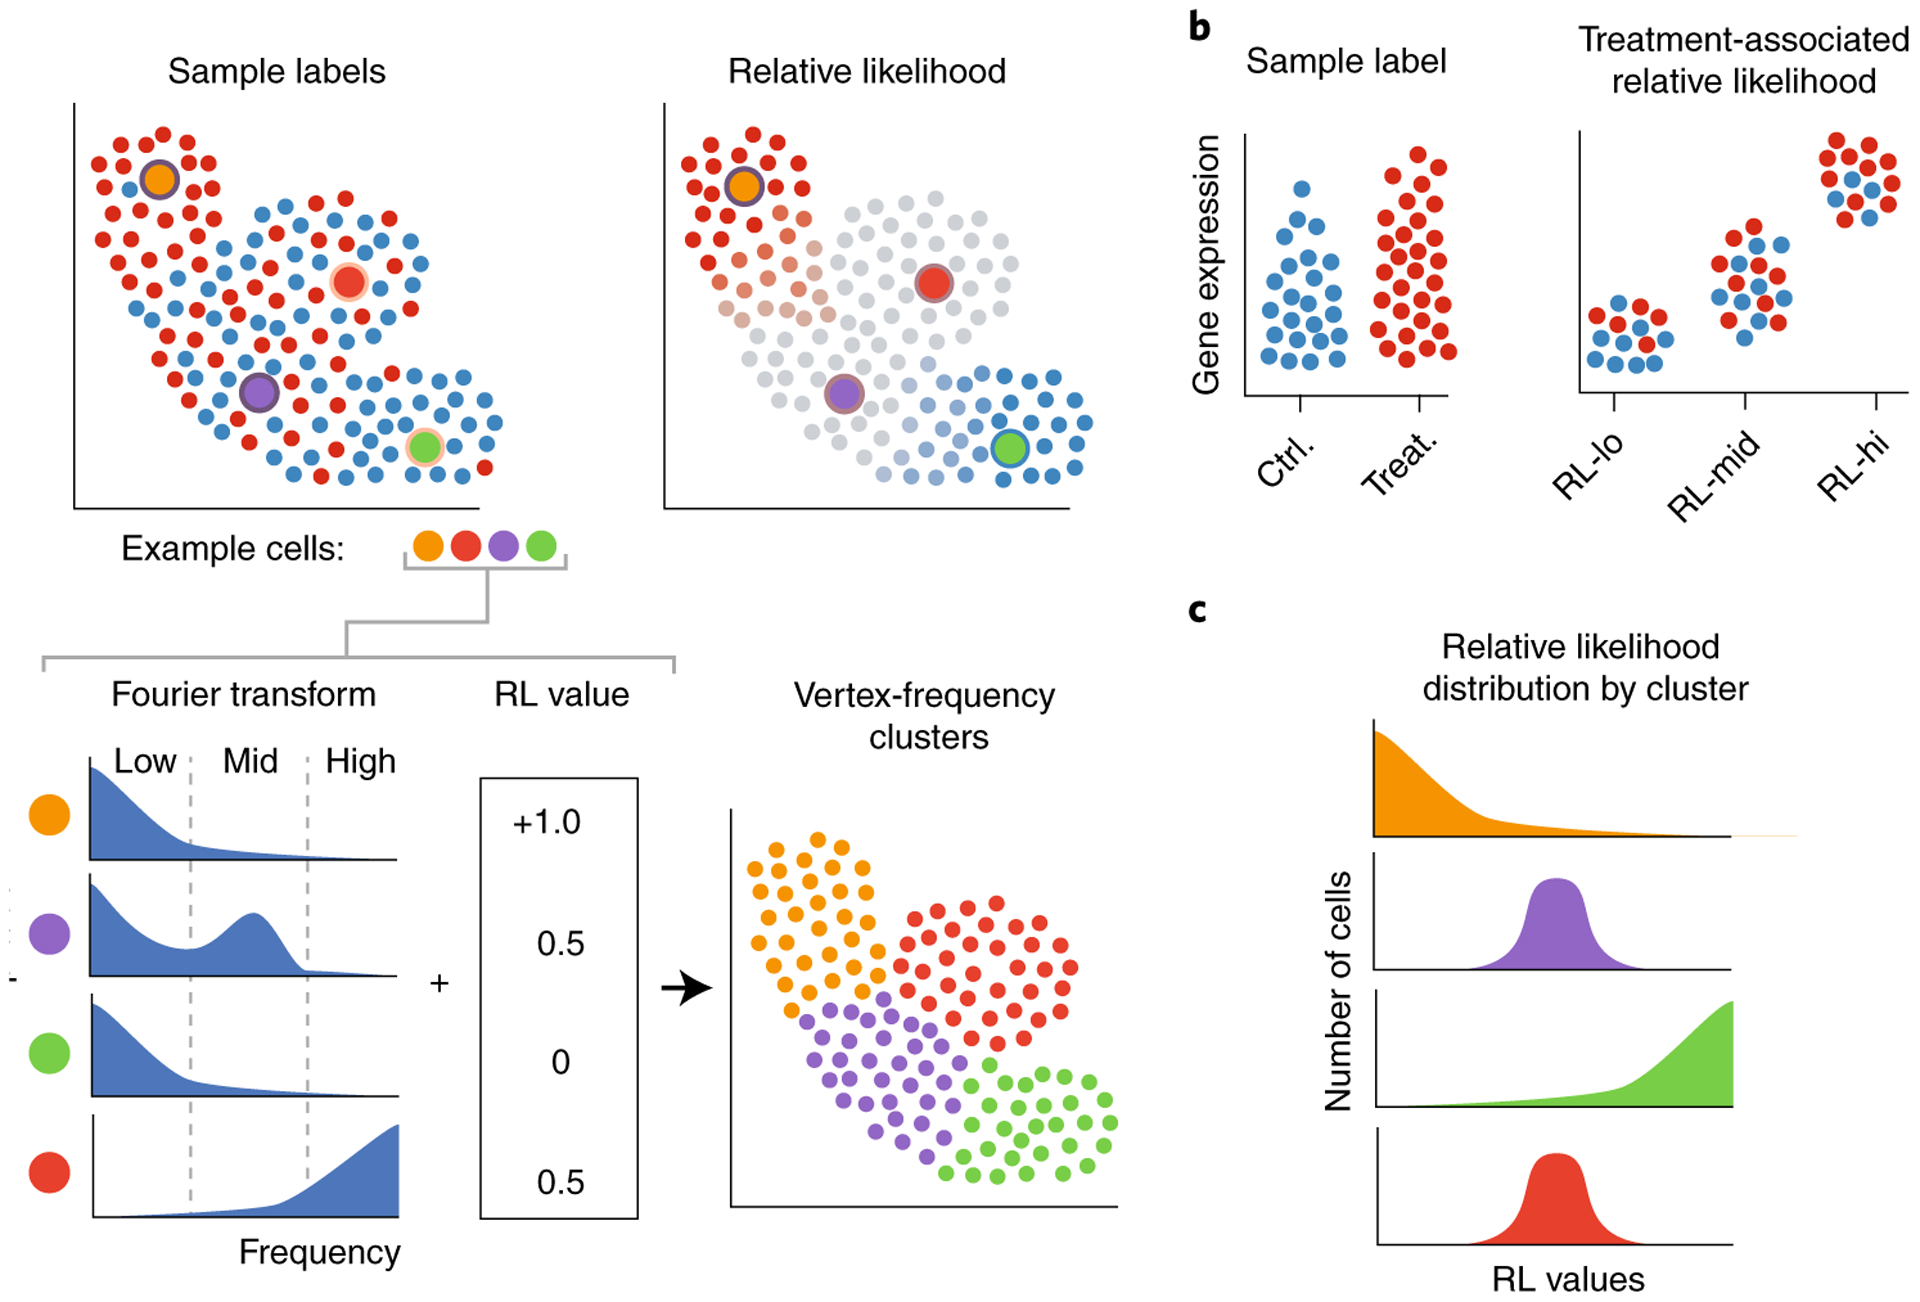
a, The WGFT of the sample-associated indicator signals and values of sample-associated relative likelihood (RL) values at four example points shows distinct patterns between a transitional (blue) and unaffected (red) cell. This information is used in spectral clustering, resulting in VFC. b, Characterizing VFCs with the highest and lowest sample-associated relative likelihood values elucidates gene expression changes associated with experimental perturbations. c, Examining the distribution of sample-associated relative likelihood scores in VFCs identifies cell populations most affected by a perturbation.