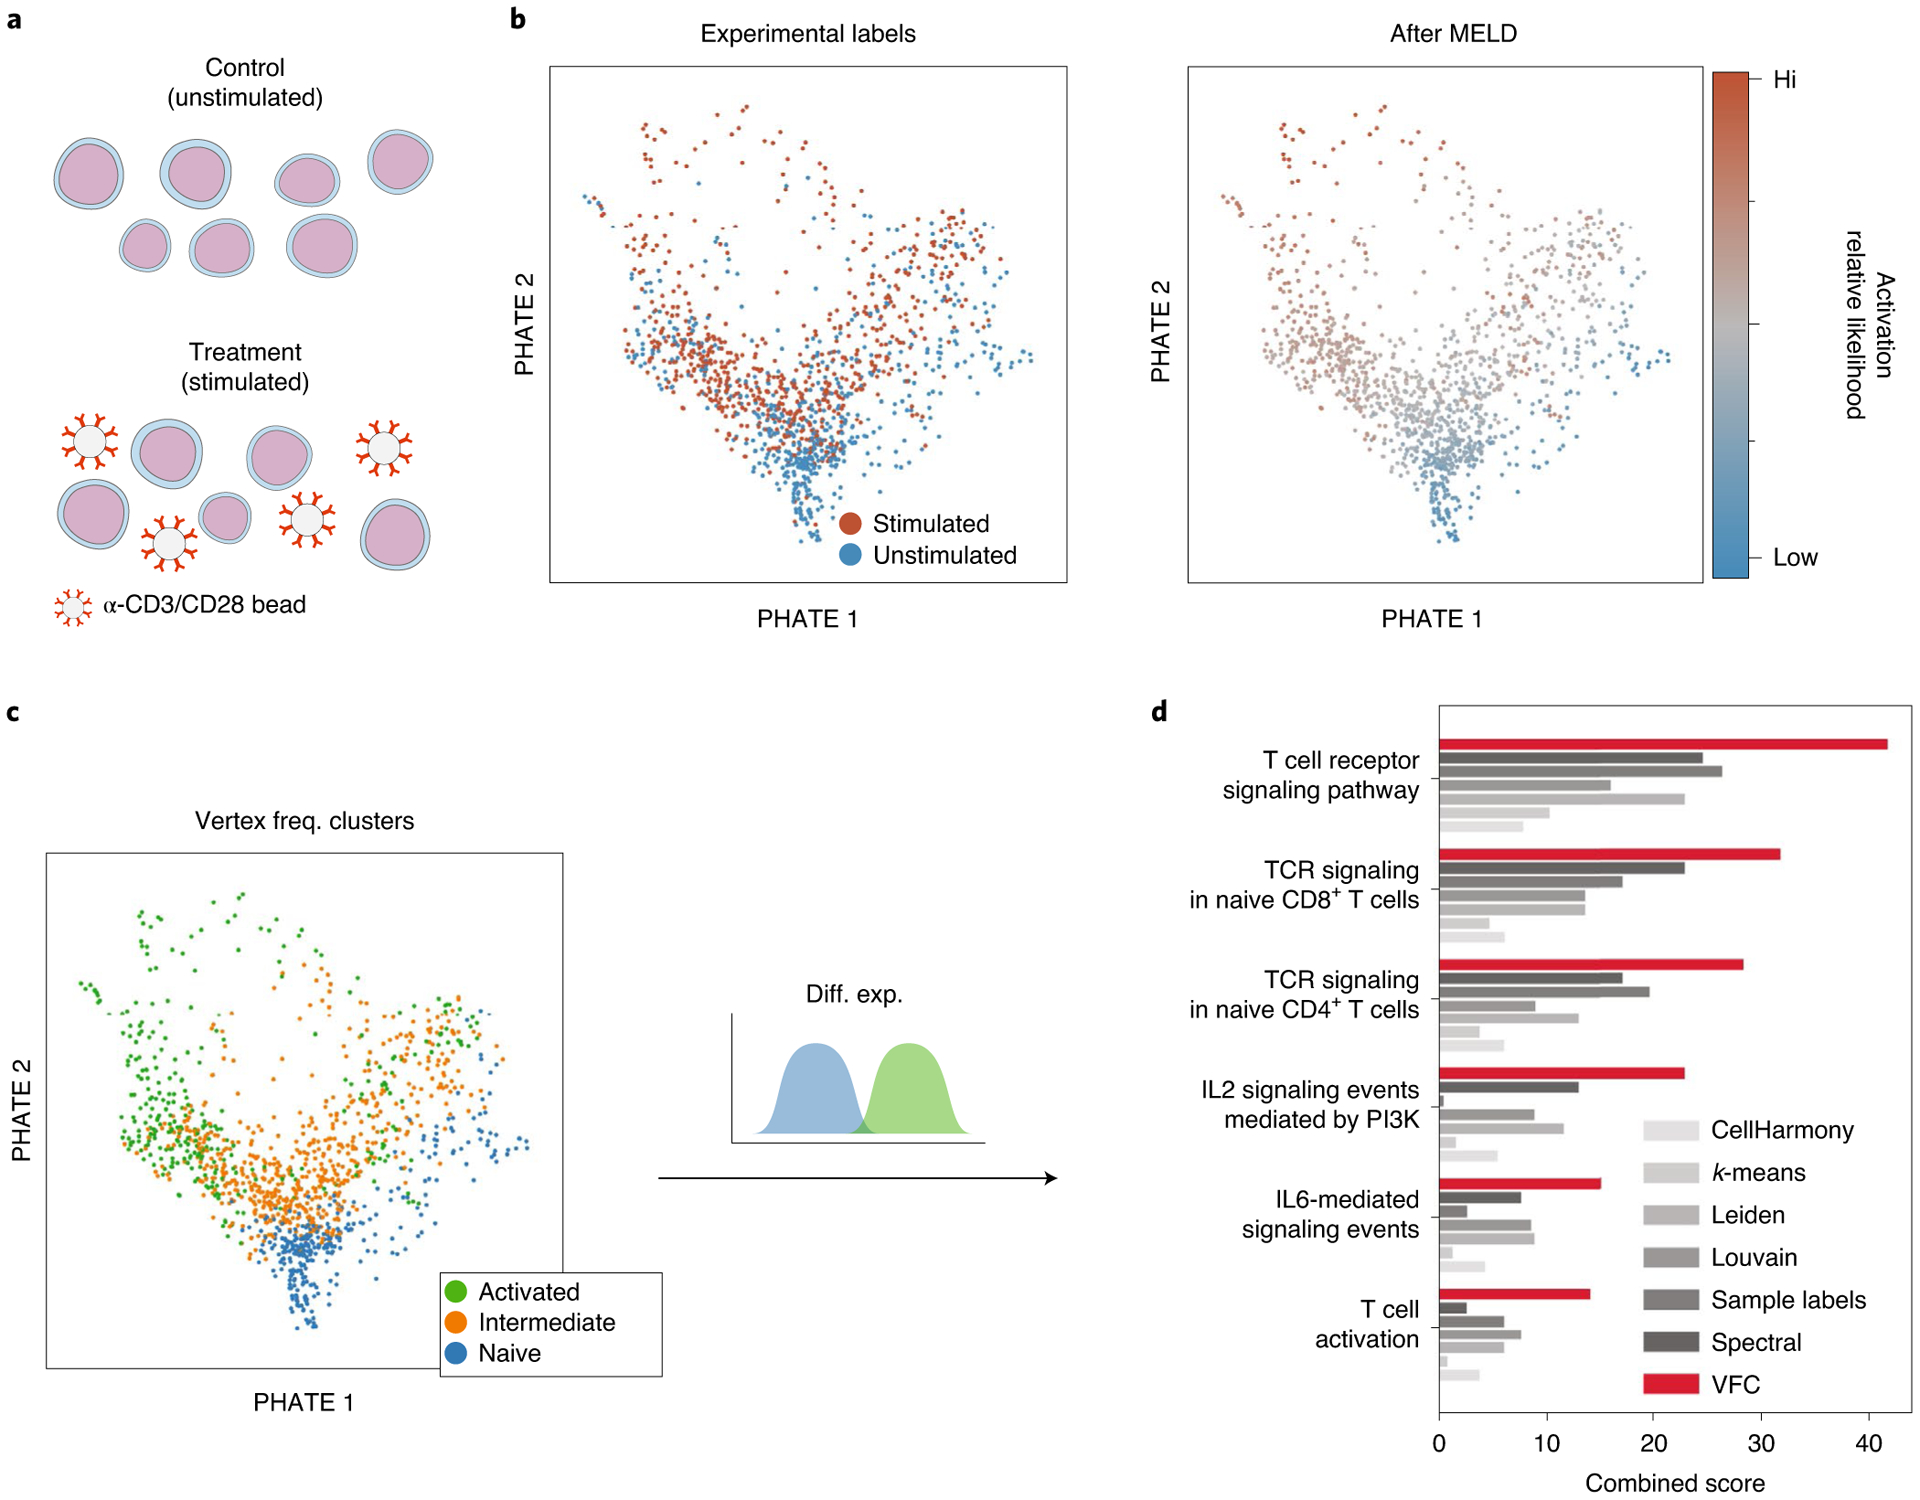
Fig. 4 |. MELD recovers signature of TCR activation.

a, Jurkat T cells were stimulated with α-CD3/CD28-coated beads for 10 d before collection for scRNA-seq. b, Examining a PHATE plot, there is a large degree of overlap in cell state between experimental conditions. However, after MELD, it is clear which cell states are prototypical of each experimental condition. c, VFC identifies an activated, a naive and an intermediate population of cells. d, Signature genes identified by comparing the activated to naive cells are enriched for annotations related to TCR activation using EnrichR analysis. Combined scores for the MELD gene signature are shown in red, and scores for a gene signature obtained using the sample labels only are shown in gray. IL, interleukin.
