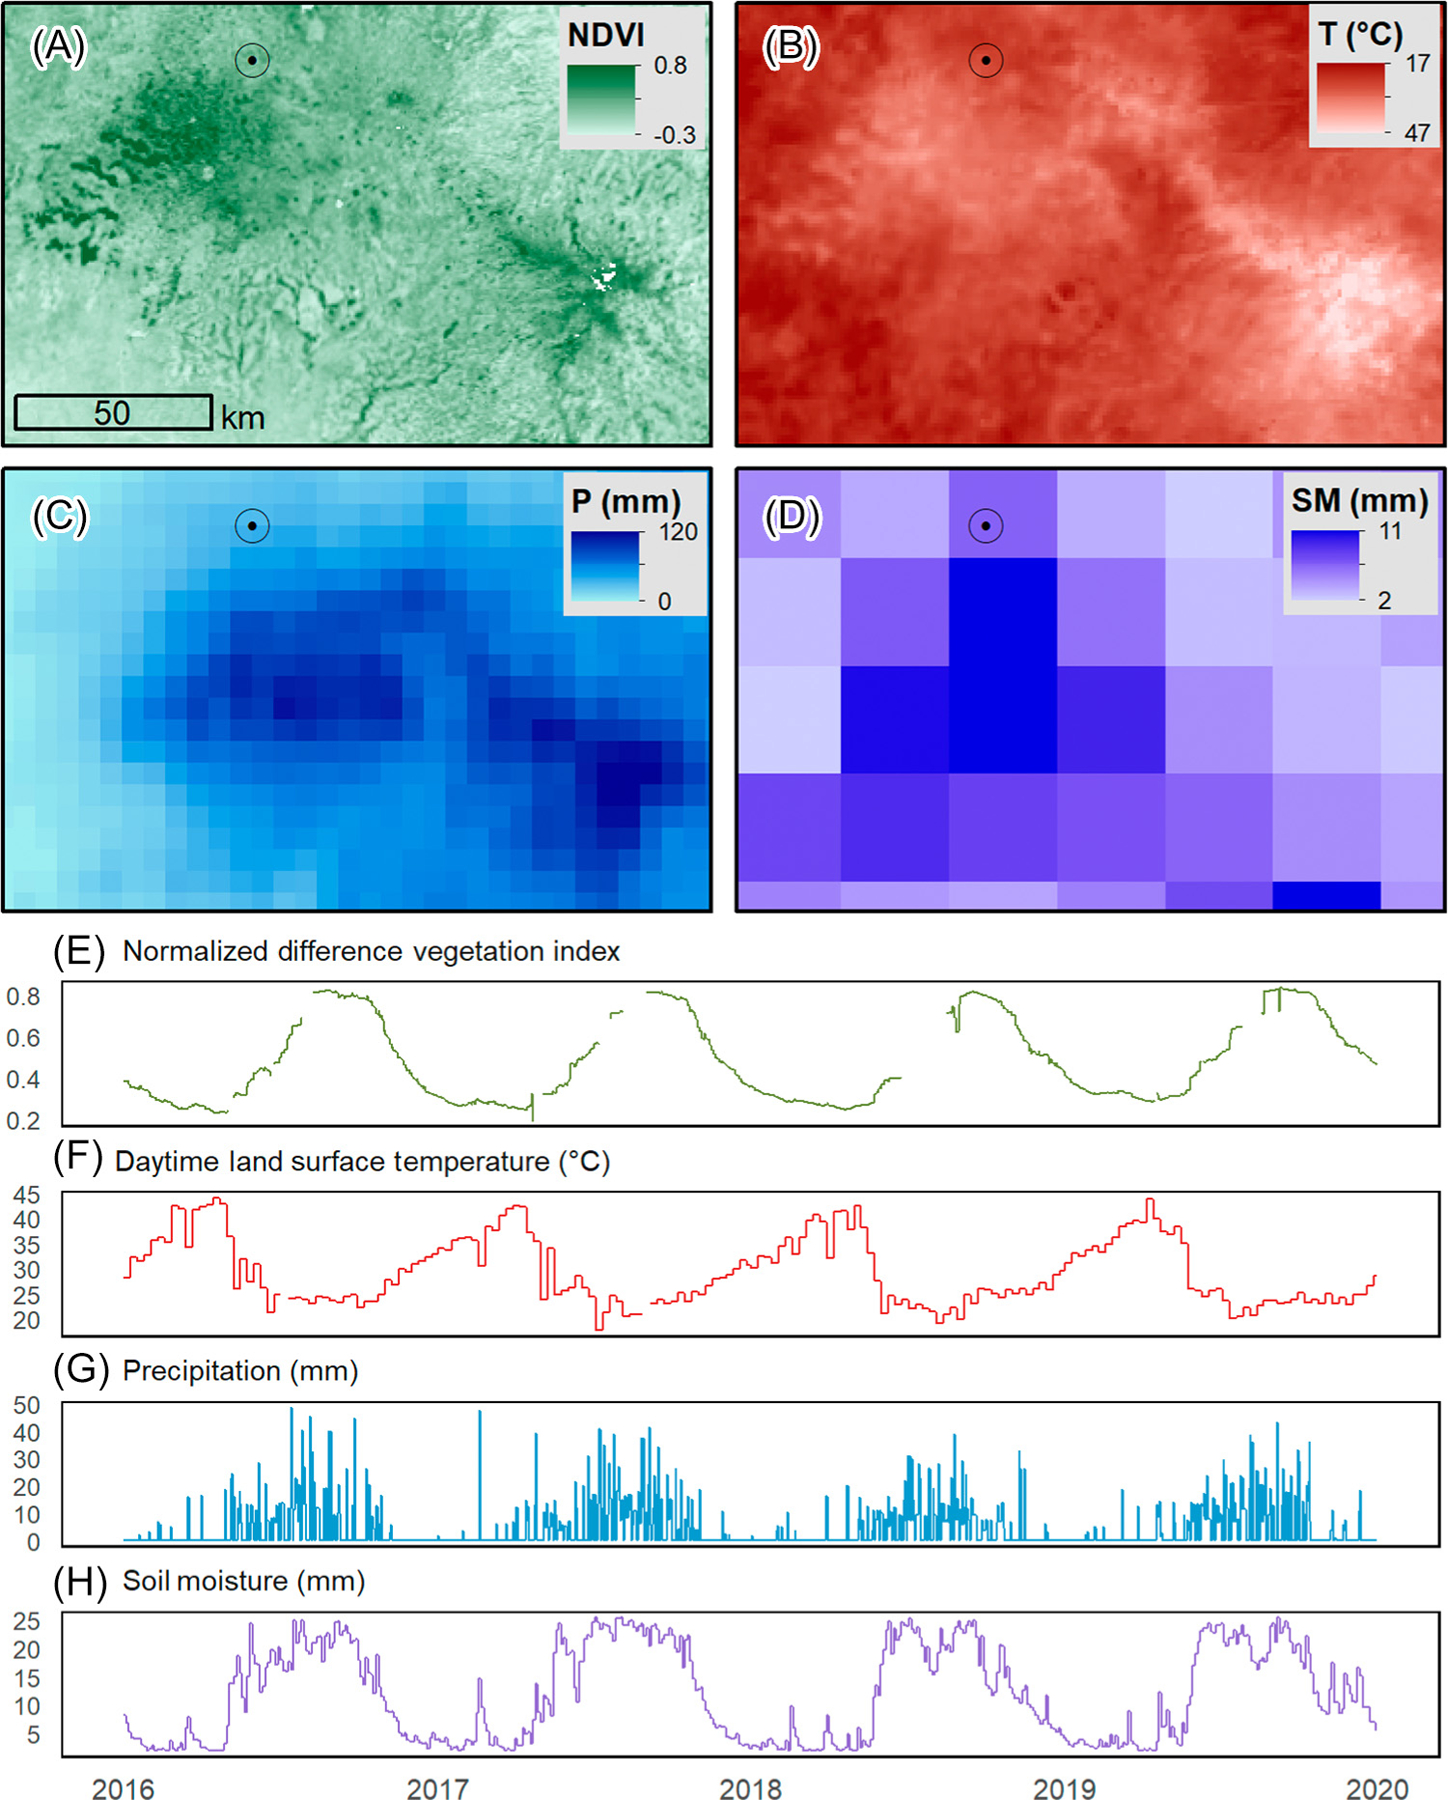
Figure 3. Satellite Data Collected over the Choke Mountains of Northwest Ethiopia in March 2019.

The four images display (A) moderate resolution imaging spectroradiometer (MODIS) normalized difference vegetation index (NDVI) on 1 March 2019; (B) MODIS daytime land surface temperature (LST) on 1 March 2019; (C) climate hazards group infrared precipitation with station (CHIRPS) total monthly precipitation from 1 March to 31 March 2019; and (D) soil moisture active passive (SMAP) soil moisture on 1 March 2019. The time series charts display 4 years of data collected at the highlighted point on the maps. (E) MODIS NDVI. (F) MODIS LST. (G) CHIRPS precipitation. (H) SMAP soil moisture. The geographic coordinates of the highlighted point are 11.292 N, 36.978 E.
