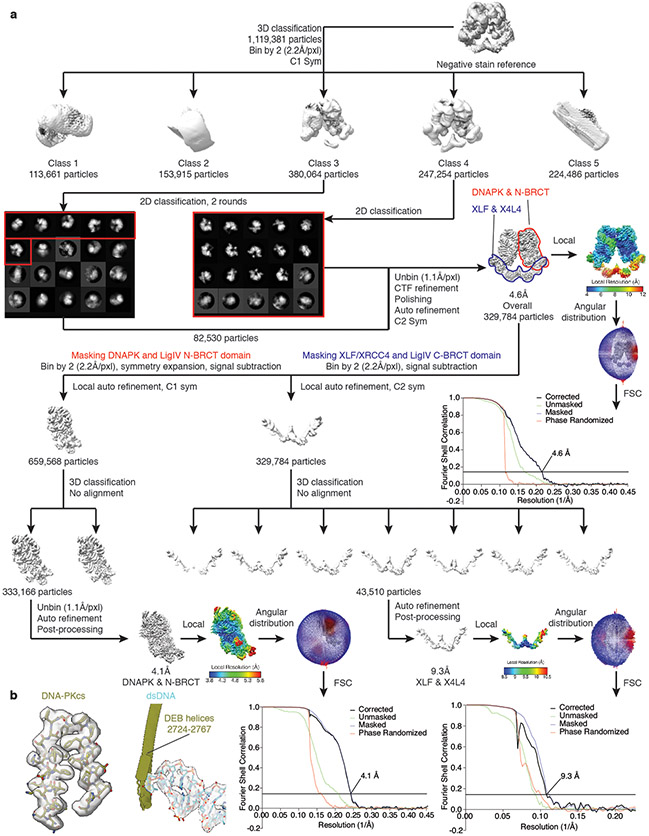
Extended Data Fig. 2. Data-processing scheme of the LR synaptic complex sample.
a, Flow chart of the cryo-EM data processing procedure. The gold-standard Fourier Shell Correlation (FSC) curves (0.143 cutoff) show the final resolution of the holo-complex and each body. b, sample maps and fitted models of DNA-PKcs (olive) and dsDNA substrate (cyan) from the LR complex are shown at 4.1Å resolution. Maps are shown as transparent surfaces, and models are shown as sticks, respectively.

