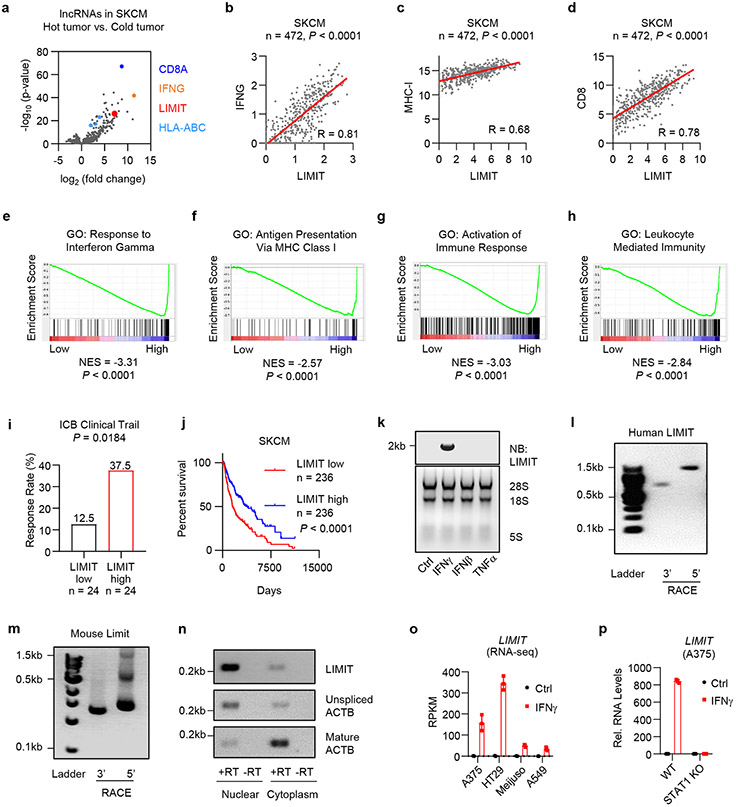
Fig. 1: LIMIT is an immunogenic lncRNA.
a. Human melanoma samples (TCGA data set, SKCM, n = 472 patients) were divided into hot and cold tumors on the basis of CD8A transcripts. The volcano plots showed the fold change and p-value of 3926 lncRNA candidates in hot tumor (CD8A, top 10%) vs. cold tumor (CD8A, bottom 10%). P value by 2-sided t-test.
b-d. Correlation of LIMIT with IFNG (b), MHC-I (c), or CD8 (d) in human melanoma patients (TCGA, SKCM). P value by 2-sided linear regression.
e-h. Human melanoma samples (TCGA, SKCM) were divided into high (n = 236 patients) and low (n = 236 patients) LIMIT tumors. Gene set enrichment analysis showed the indicated gene signatures. P value by GSEA analysis.
i. Cancer patients having received immune checkpoint blockade (ICB) therapy were divided into low and high LIMIT groups (bottom 15% vs top 15%). The response rates to ICB were calculated as the percentages of partial response (PR) plus complete response (CR). P value by Chi-square test. Patients were from 4 cohorts.
j. Survival plot of melanoma patients (TCGA, SKCM). Patients were divided into high (n = 236 patients) and low (n = 236 patients) LIMIT groups. P value by 2-sided log-rank test.
k. A375 cells were treated with indicated cytokines (5 ng/ml) for 24 hours. LIMIT was detected by Northern blotting. The 28S rRNA, 18S rRNA, and 5S rRNA are shown as loading controls.1 of 2 experiments is shown.
l-m. 5’RACE and 3’RACE of human LIMIT (l) or murine Limit (m). 1 of 2 experiments is shown.
n. A375 cells were treated with IFNγ for 24 hours. LIMIT was detected by RT-PCR in nuclear or cytoplasmic RNAs. The unspliced and mature ACTB were served as controls for nuclear and cytoplasmic RNAs, respectively. 1 of 2 experiments is shown.
o. RPKM of LIMIT in different cancer cells in response to IFNγ.
p. Wild type (WT) or STAT1 knockout (KO) A375 cells were treated with 5 ng/ml IFNγ for 24 hours. RNA levels of LIMIT were quantified by qRT-PCR.
All Data are mean ± SD.
n = 3 biological independent samples in (o, p).
Source data are provided in Soure_data_Fig1.xlsx and Unmodified_blots_Fig1.pdf.

