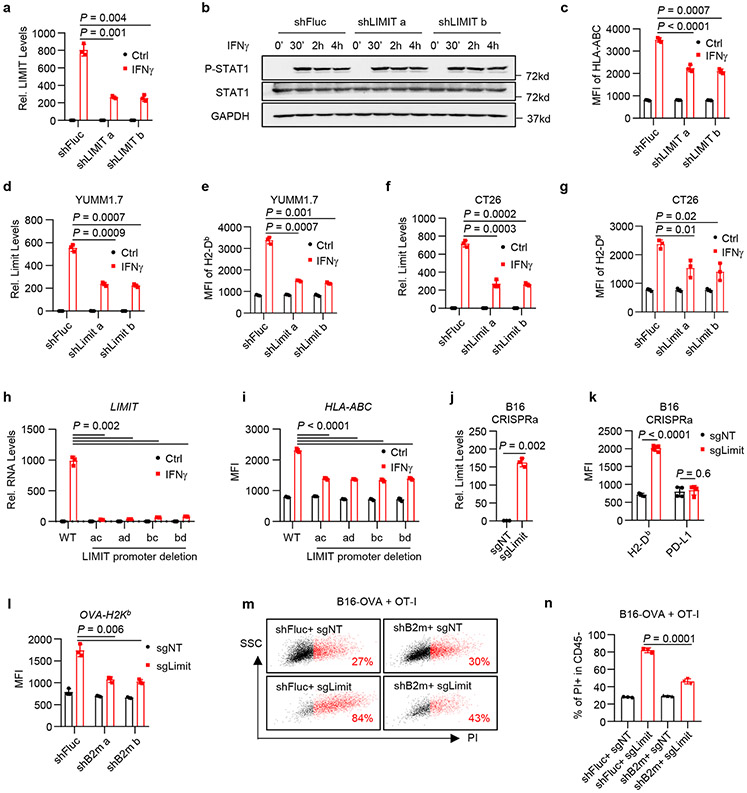
Fig. 2: LIMIT augments MHC-I expression.
a. A375 shFluc or shLIMIT cells were treated with IFNγ for 24 hours. RNA levels of LIMIT were determined by qRT-PCR. P value by 2-sided t-test.
b. A375 shFluc or shLIMIT cells were treated with IFNγ for the indicated time. Protein levels of phospho-STAT1 (p-Y701), STAT1, and GAPDH were determined by Western blotting. 1 of 2 experiments is shown.
c. A375 shFluc or shLIMIT cells were treated with IFNγ for 48 hours. Surface expression of HLA-ABC were determined by flow cytometry (FACS). P value by 2-sided t-test.
d-g. YUMM1.7 (d, e) or CT26 (f, g) cells carrying shFluc or shLimit were treated with IFNγ. RNA levels of Limit were determined 24 hours after treatment (d, f). Surface staining of MHC-I (H2-Db) was detected 48 hours after treatment (e, g). P value by 2-sided t-test.
h-i. A375 WT or LIMIT promoter deletion cells were treated with IFNγ. RNA levels of LIMIT were determined 24 hours after treatment (h). Surface expression of HLA-ABC were determined 48 hours after treatment (i). P value by 2-sided t-test.
j-k. B16 cells were transfected with dCas9-VPR, together with non-targeting sgRNA (sgNT) or sgRNA targeting the promoter of Limit (sgLimit). RNA levels of Limit were determined 24 hours after treatment (j). Surface expression of MHC-I (H2-Db) or PD-L1 were determined 48 hours after treatment (k). P value by 2-sided t-test.
l. B16-OVA cells carrying shFluc or shB2m were manipulated with Limit CRISPRa (sgLimit) for 48 hours. Surface expression of OVA-H2Kb were determined by FACS. P value by 2-sided t-test.
m-n. B16-OVA cells were manipulated with B2m knocking down (shB2m) or Limit CRISPRa (sgLimit), and co-cultured with OT-I cell at the ratio of 1:4. Cell death was measured by PI staining in CD45− tumor cells. Dot plots (m) and statistical results (n) are shown. P value by 2-sided t-test.
All data are mean ± SD.
n = 3 biological independent samples in (a, c, d, e, f, g, h, i, j, k, l, n).
Source data are provided in Soure_data_Fig2.xlsx and Unmodified_blots_Fig2.pdf.

