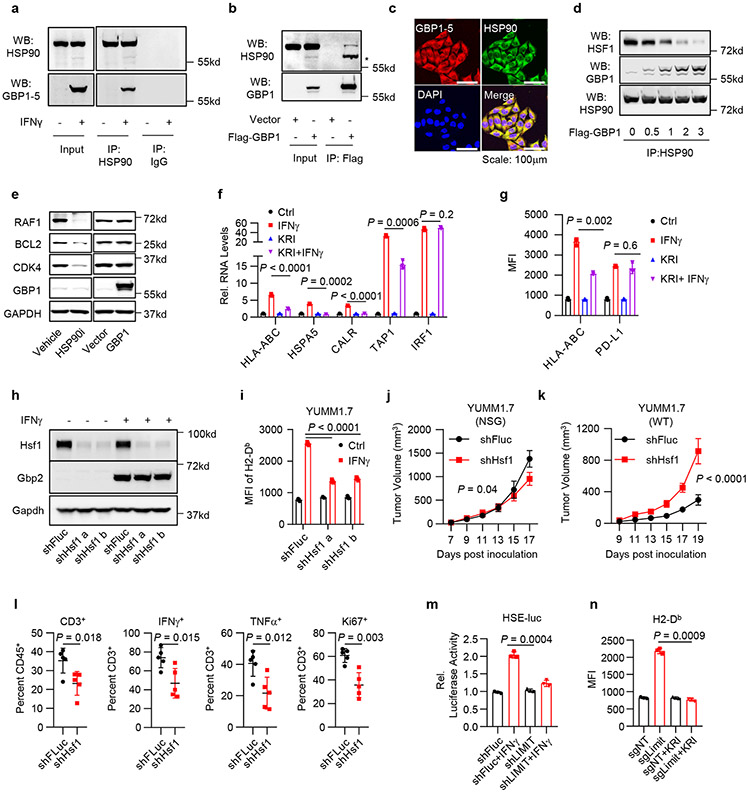
Fig. 6: LIMIT-GBP-HSF1 axis drives MHC-I and tumor immunity.
a. Co-IP of GBP1-5 with HSP90 antibody in IFNγ-pretreated A375 cells. 1 of 3 experiments is shown.
b. Co-IP of HSP90 with Flag antibody in Flag-GBP1-overexpressed A375 cells. * indicated the band shift of HSP90 upon GBP1 overexpression. 1 of 2 experiments is shown.
c. Immunofluorescence staining of GBP1 and HSP90 in IFNγ-pretreated A375 cells. 1 of 4 images is shown.
d. 293T cells were forced expression of Flag-HSF1 and increased doses of Flag-GBP1. Co-IP of HSF1 or GBP1 with HSP90 antibody were performed 24 hours afterwards. 1 of 2 experiments is shown.
e. A375 cells were treated with HSP90 inhibitor, or forced expression of GBP1. Indicated proteins were detected 48 hours afterwards. 1 of 2 experiments is shown.
f-g. A375 cells were treated with IFNγ and KRIBB11. RNA (f) or surface staining (g) levels of indicated genes were determined 48 hours afterwards. P value by 2-sided t-test.
h. YUMM1.7 shFluc or shHsf1 cells were treated with IFNγ. Total protein (h) or surface expression (i) levels of indicated genes were determined 48 hours afterwards. 1 of 2 experiments is shown. P value by 2-sided t-test.
j-k. Tumor growth curves of YUMM1.7 shFluc or shHsf1 cells in NSG mice (j) or wild type C57BL/6 mice (k). n = 5 (j) or 6 (k) animals, P value by 2-sided t-test for end point tumor volume.
l. Percentages of CD3+, Ki67+, IFNγ+, and TNFα+ T cells in YUMM1.7 shFluc or shHsf1 tumors. n = 5 biological independent samples, P value by 2-sided t-test.
m. A375 shFluc or shLIMIT cells were transfected with HSE-luc and PRL-SV40 overnight, and then treated with IFNγ for additional 48 hours. HSF1 transcriptional activity is depicted as the relative luciferase activity. P value by 2-sided t-test.
n. B16 cells were manipulated with Limit CRISPRa and treated with KRIBB11. Surface expression of MHC-I (H2-Db) was determined 48 hours afterwards. P value by 2-sided t-test.
All data are mean ± SD.
n = 3 biological independent samples in (f, g, i, m, n).
Source data are provided in Soure_data_Fig6.xlsx and Unmodified_blots_Fig6.pdf.

