Figure 3.

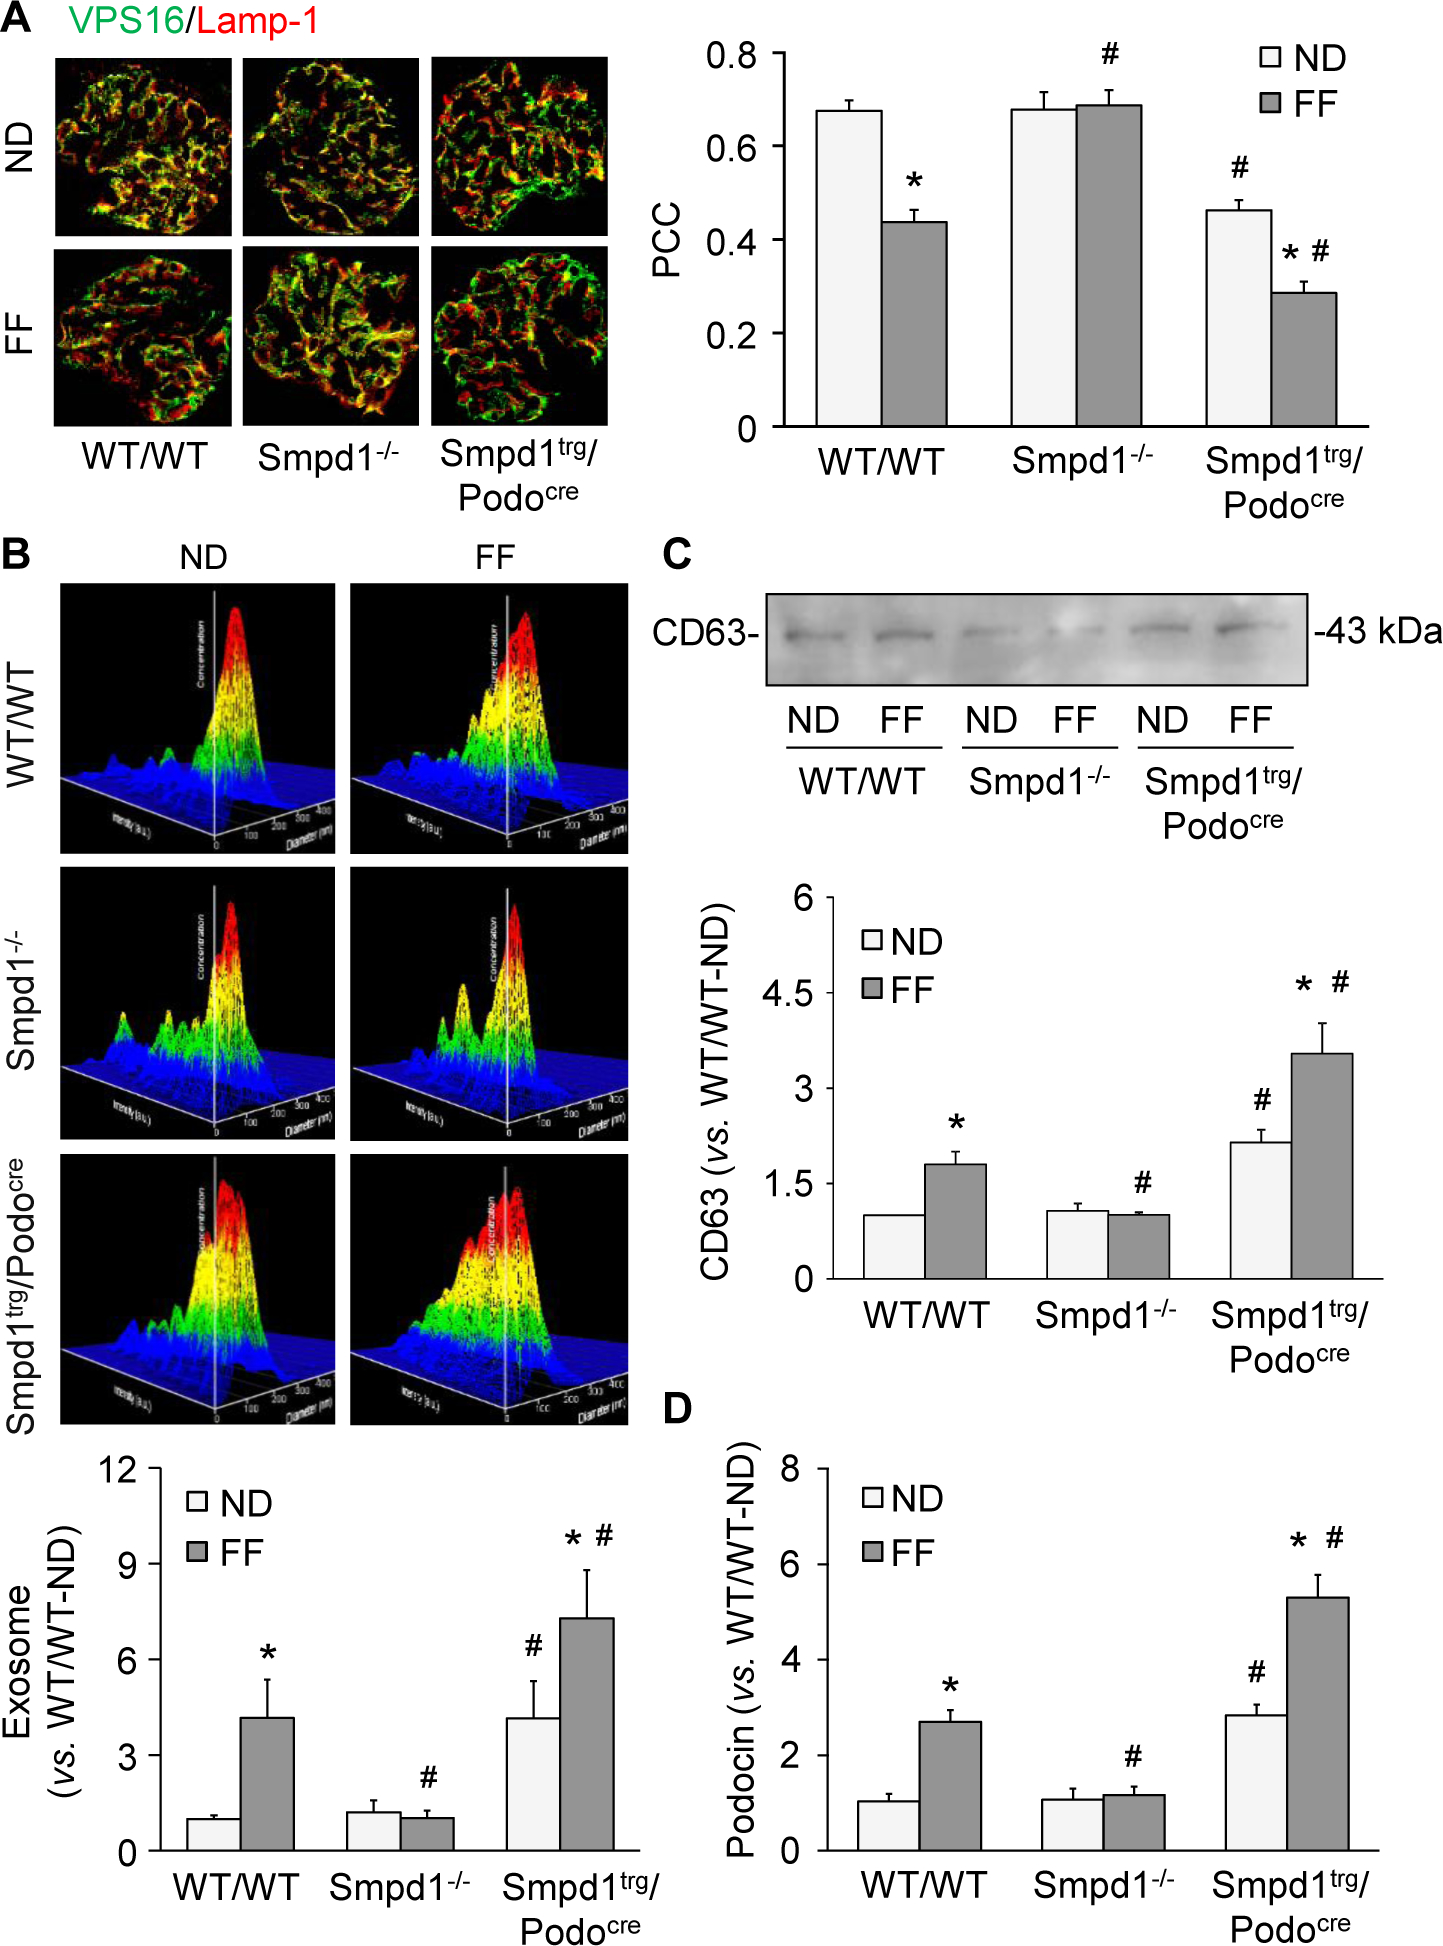
Decreased glomerular lysosome-MVB interaction during hHcy. A. Representative images and summarized data showing the colocalization of VPS16 (green fluorescence) and Lamp-1 (red fluorescence) in glomeruli of different groups of mice (n=5–8). B. Representative images and summarized data showing the urinary exosome excretion in different groups of mice (n=7–13). C. Representative Western blot images and summarized data showing the urinary levels of CD63 in different groups of mice (n=5–6). D. Urinary levels of podocin in different groups of mice (n=6). * P<0.05 vs. ND group. # P<0.05 vs. WT/WT group.
