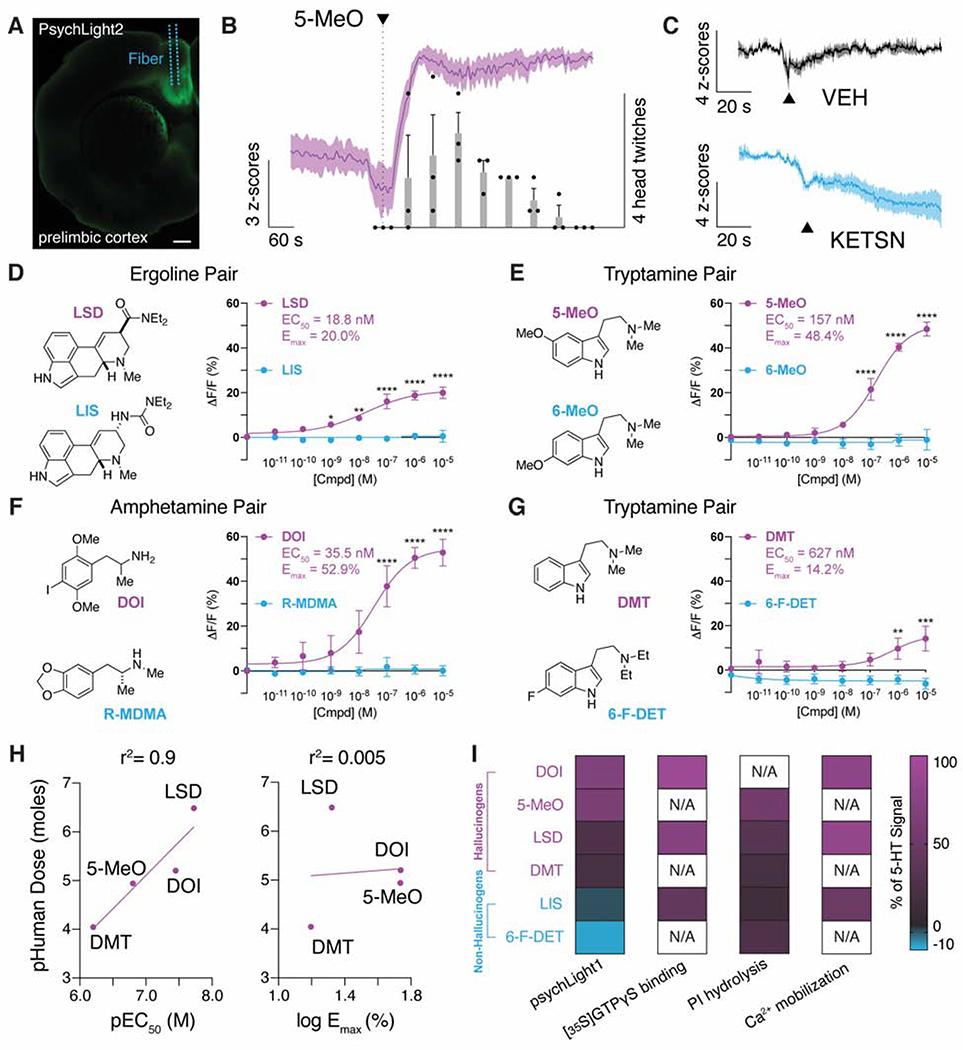
Figure 3. PsychLight is activated by hallucinogenic drugs in vivo and in vitro.
A–C. PsychLight2 in vivo responses to drugs as measured by fiber photometry. A. Expression of psychLight2 in the prelimbic cortex near the site of fiber implantation. Scale bar: 500 μm. B. Averaged-trial traces of psychLight2 responses shown as z-score following injection of 50 mg/kg 5-MeO (magenta, i.p.). The number of head-twitch responses (bars) were also recorded and binned into 1-min intervals (n = 3 animals). C. Averaged-trial traces of psychLight2 responses following the injection either of the saline (VEH; top black) or an antagonist (4 mg/kg KETSN, bottom blue, i.p.) (n = 3 animals). Average traces indicated by solid lines; shaded area represents S.E.M. D–G. Concentration-response studies using HEK293T cells transiently expressing psychLight1. Hallucinogens of the ergoline, tryptamine, and amphetamine classes of psychedelics (magenta) were tested along with their non-hallucinogenic congeners (blue). Hallucinogens activated psychLight1 while their non-hallucinogenic congeners did not. n = 3 cells from 3 different cell passages; Error bars represent S.E.M., *P<0.05, **P<0.01, ***P<0.001, ****P<0.0001, compared to the non-psychedelic drug, two-way ANOVA. H. PsychLightl EC50 values, but not Emax values, correlate with hallucinogen potencies in humans. I. PsychLightl Emax values differentiate hallucinogens and non-hallucinogens, but other measures of 5-HT2AR activation (e.g., phosphoinositide (PI) hydrolysis, Ca2+ mobilization, [35S]GTPγS binding) do not. Data represented by the heatmap with a double color gradient from values above 0 (magenta to black) and data below 0 (black to blue). Data are normalized to 5-HT values within each experiment. Data for PI hydrolysis, Ca2+ mobilization, and [35S]GTPγS binding were obtained from previous reports (Cussac et al., 2008; Rabin et al., 2002). PI hydrolysis data for 6-F-DET were estimated based on graphical data presented in Rabin, et al. 2002. N/A indicates that the data are not available. See also Supplementary Fig. 3A–B.

