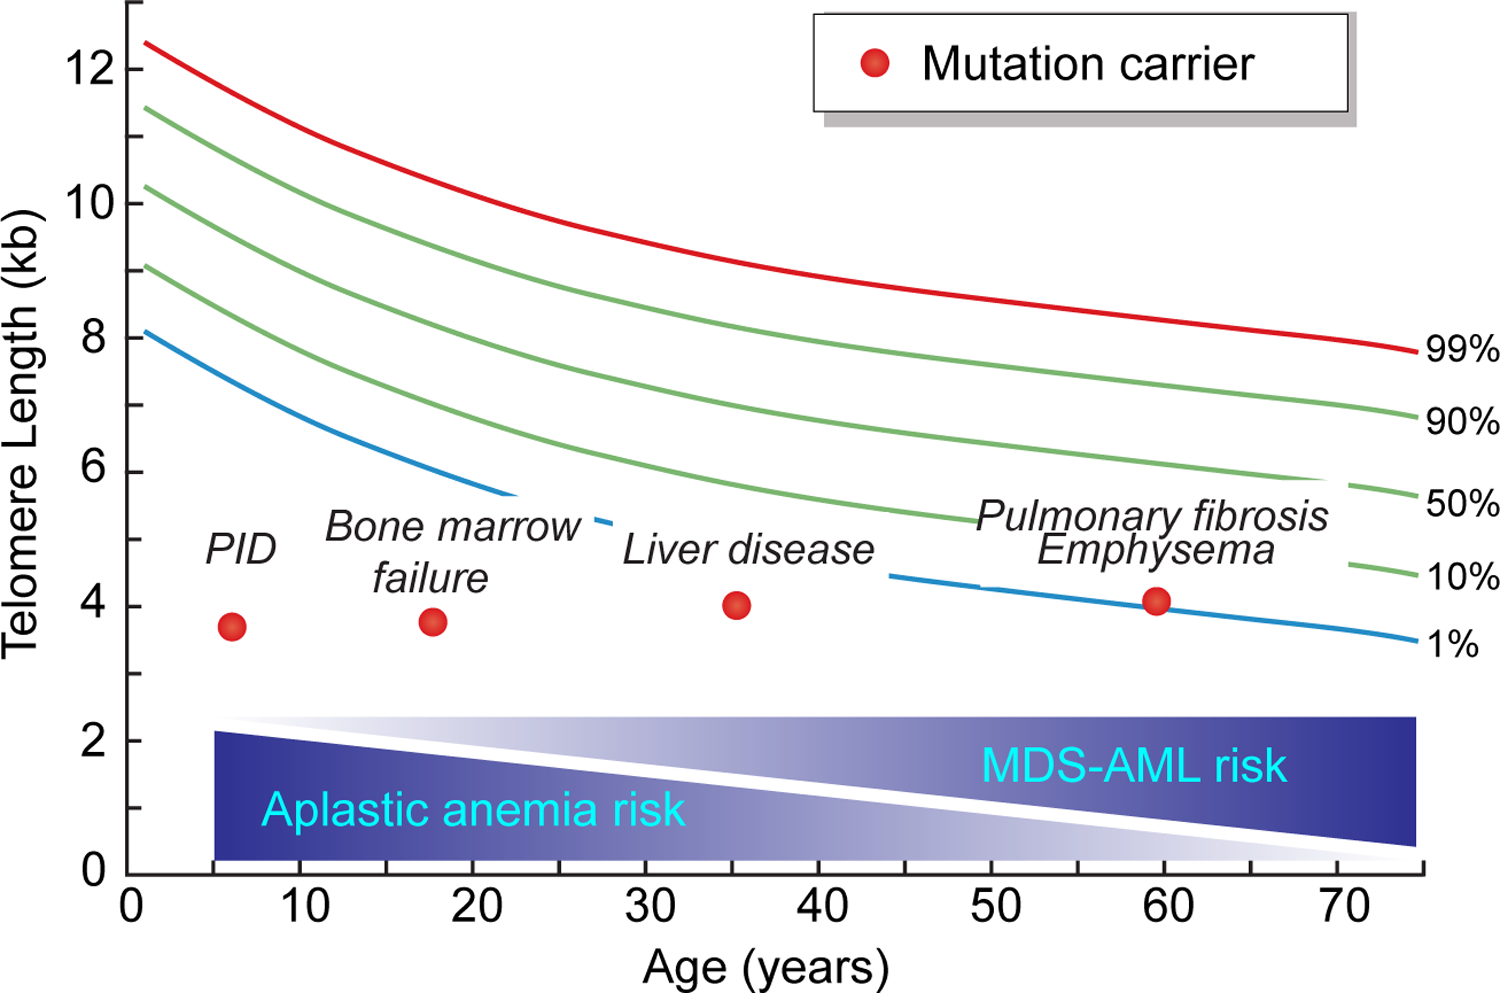
Figure 1. Age-dependent phenotypes of the short telomere syndromes.

The four short telomere syndrome presentations are shown on a schematic telogram relative to the normal population percentiles. Each dot refers to an individual patient at the typical age at diagnosis. The gradient schemes below show the decreasing risk of aplastic anemia with age along with the concurrent increase in myelodysplastic syndrome (MDS) and acute myeloid leukemia (AML) risk with age.
