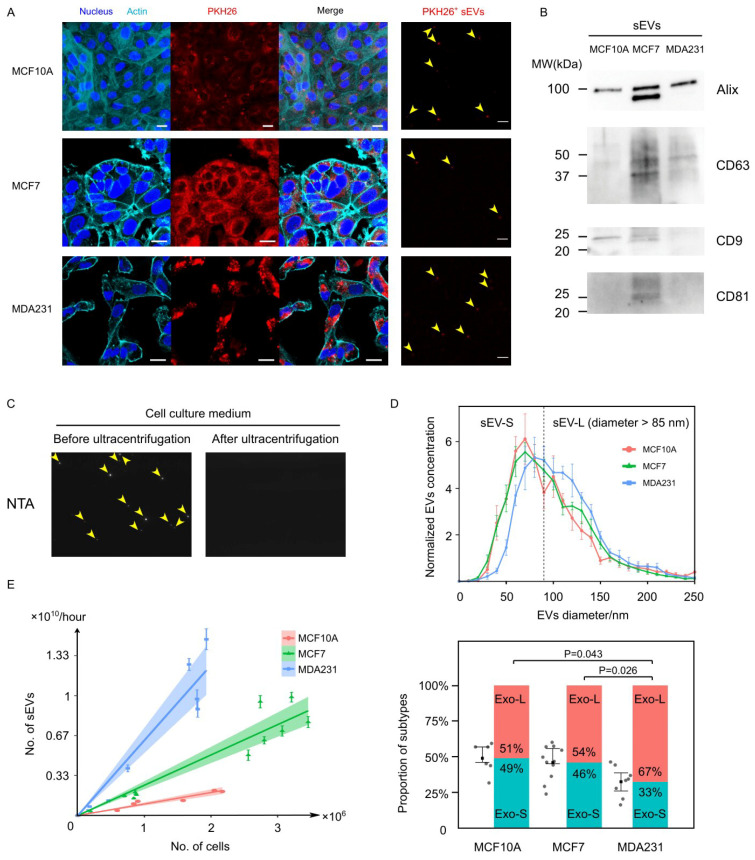
Figure 1.
Characterization of cancer and normal cell-derived EVs. (A) Breast cell lines MCF10A, MCF7 and MDA231 were stained with cell membrane dye PKH26 and incubated to generate PKH26+ EVs. Scale bars = 20 µm for left three columns and scale bars = 5 µm for the sEVs column. (B) An estimated 10 ug of total sEV proteins were used for western blot. The sEV protein markers including Alix, CD63, CD9 and CD81 were enriched. Because the BCA protein assay had limited accuracy at the range of EV protein concentration, the actual amount of protein in each lane might vary. (C) Crude EVs in the culture medium were detected and counted by Nanoparticle Tracking Analysis. Ultracentrifugation removed all the detected particles, suggesting that these particles were indeed EVs. (D) Normalized size distribution of EV for MCF10A (N = 6), MCF7 (N = 11) and MDA231 (N = 8). The EVs derived from all three cell lines have a diameter of 50–150 nm, with the MDA231-derived EVs showing a rightward shift compared to the other two cell lines. Dividing the EVs into smaller and larger subtypes with a threshold diameter of 85 nm, the MDA231-sEVs constitute prominently higher proportions of sEV-L subtype. Error bars stand for the 25th and 75th percentile. P values are calculated based on Mann–Whitney U test. (E) Scatter plot shows EV number and cell number were linearly correlated, with the coefficients distinguishable between cell lines. The rank of the EV generation rate was MCF10A < MCF7 < MDA231. Error bars of each point stand for the standard error of the mean (SEM). Data were fitted by linear regression with zero intercept, with the 95% confidence interval highlighted in color.

