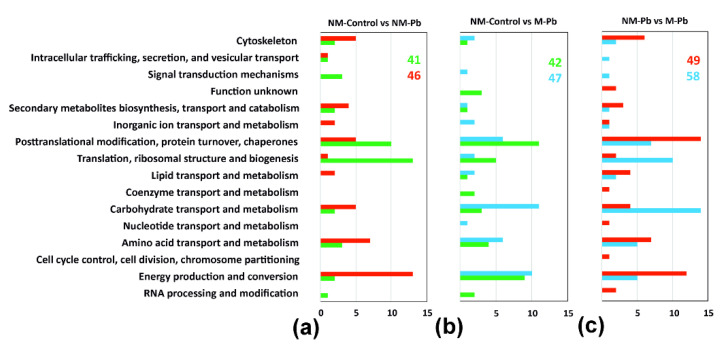
Figure 3.
Protein classification according to COG (Clusters of Orthologous Groups) classes. Differentially abundant proteins detected in three independent two-sample T tests, NM-Control vs. NM-Pb (a), NM-Control vs. M-Pb (b) and NM-Pb vs. M-Pb (c), were divided into the COG classes according to the proteins that were more abundant in a particular treatment group. The following color codes were used for all classes: green columns, more abundant in NM-Control roots; red columns, more abundant in M-Pb roots; blue column, more abundant in M-Pb roots. The total number of upregulated proteins in a given treatment group and COG class (x-axis) are given.

