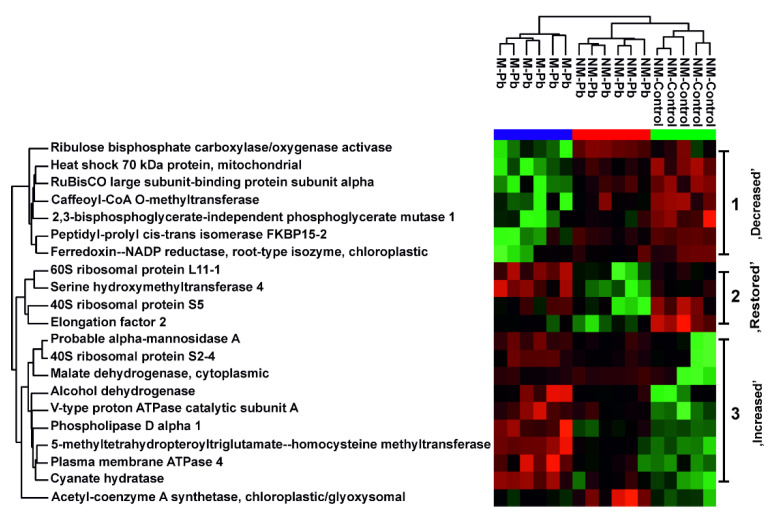
Figure 4.
Common root proteins. The heat map analysis combined with hierarchical cluster analysis showing the ion intensities of proteins identified as differentially abundant according to all three two-sample test T tests: NM-Control vs. NM-Pb, NM-Control vs. M-Pb and NM-Pb vs. M-Pb. Green, minimal abundance; red, maximal abundance. Ion intensities were log2-transformed, batch-corrected and Z-scored for each row. Three protein clusters are clearly visible: proteins with decreased abundance in the series NM-Control→NM-Pb→M-Pb, proteins with similar abundance in NM-Control and M-Pb roots but with decreased abundant in NM-Pb poplars (so-called ‘restored’ proteins) and proteins with increased abundance in the series NM-Control→NM-Pb→M-Pb.

