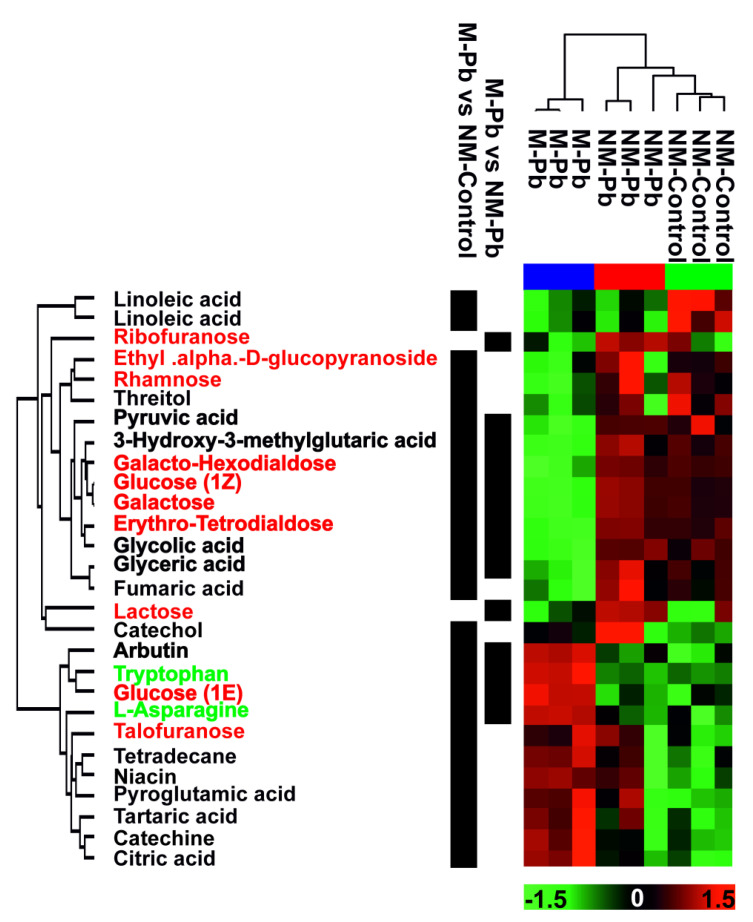
Figure 5.
Metabolomic data. Heat map analysis combined with hierarchical cluster analysis showing poplar root ‘primary metabolites’ (GC MS/MS experiment) that are differentially abundant (p < 0.05) according to the multisample ANOVA test. Green, minimal abundance; red, maximal abundance. Ion intensities were log2-transformed, batch-corrected and Z-scored for each row. None of the differentially abundant compounds were detected between NM-Controls and NM-Pb roots (according to the T test). Compounds differently abundant according to the two remaining T tests (NM-Control vs. M-Pb and NM-Pb vs. M-Pb) are marked. Green font: amino acids, red font: carbohydrates. Bold: compounds identified as differently abundant according to both T tests (NM-Control vs. M-Pb and NM-Pb vs. M-Pb).

