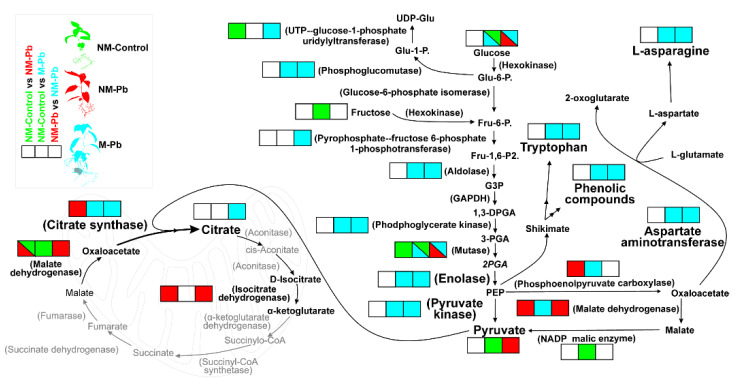
Figure 6.
Primary metabolic alterations under Pb exposure. The color code (green: increased in NM-Control roots; red: increased in M-Pb roots; blue: increased in M-Pb roots; white: nonsignificant change or not detected) is used to represent changes in the abundances of the identified enzymes (involved mainly in glycolysis and TCA) and selected metabolites according to three independent T tests: NM-Control vs. NM-Pb (1), NM-Control vs. M-Pb (2) and NM-Pb vs. M-Pb (3; square boxes from left to right). The most important changes are marked with a larger font.

