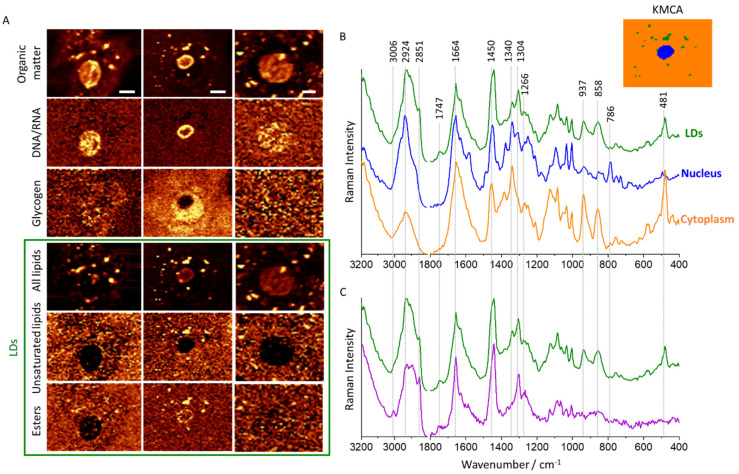
Figure 1.
Subcellular distribution of lipids in cervical epithelial cells. Representative Raman images of cervical epithelial cells (N−, LSIL+, LSIL+) (A) obtained by integration in the regions: 2830–3030 cm−1 (all organic matter), 770–800 cm−1 (DNA & RNA), 900–955 cm−1 (glycogen), 2830–2900 cm−1 (total lipids), 2990–3020 cm−1 (unsaturated lipids) and 1715–1760 cm−1 (esters). Average Raman spectra and representative K-means cluster analysis image (B) showing the distribution of main classes in cervical epithelial cells: orange—cytoplasm, blue—nucleus, green—LDs. Average Raman spectra of LDs with an utmost difference of lipid unsaturation and glycogen content (C) of different cells indicating their heterogeneity. Scale bars equal 6 µm.

