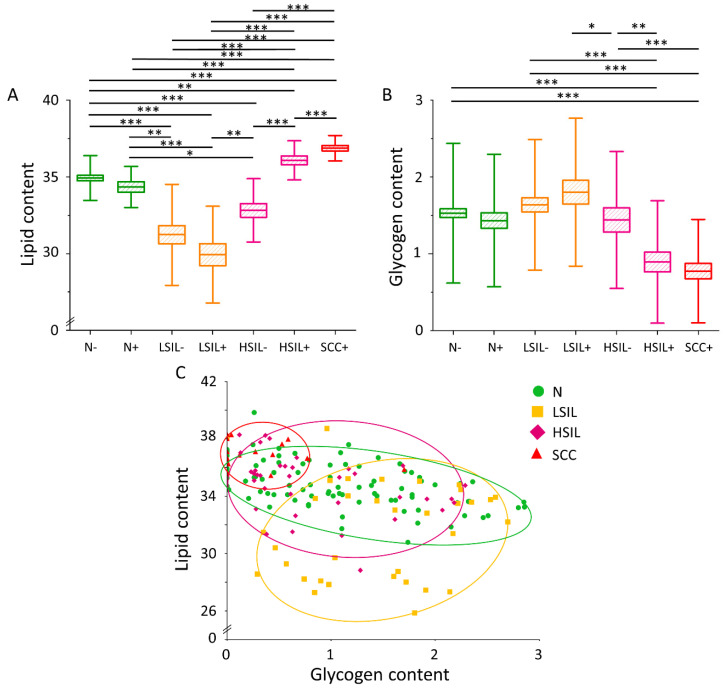
Figure 2.
Lipid and glycogen contents in the cytoplasm of cervical epithelial cells depending on the degree of dysplasia and HPVhr infection. The comparison of the lipid (A) and glycogen (B) content in the cytoplasm of cervical epithelial cells in the studied groups obtained by calculations of the integral intensity in the 2830–3000 cm−1 and 458–482 cm−1 range, respectively. Mean values ± SEM are given as box plots: mean (horizontal line), SEM (box), SD (whiskers). Lipid content as a function of glycogen content in the cytoplasm of cervical epithelial cells (C) The average lipid and glycogen contents obtained by calculations of the integral intensity of the marker bands in the 2830–3000 cm−1 and 458–482 cm−1 range, respectively) in the studied groups. Each mark represents data for one cell. A significant correlation was obtained for the N (p < 0.001) and HSIL (p < 0.01) groups. * p < 0.05, ** p < 0.01, *** p < 0.001.

