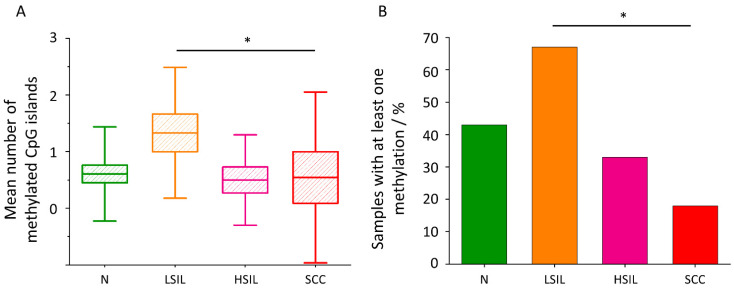
Figure 4.
CpG island methylation in the SREBF1 gene. The comparison of the mean number of methylated CpG islands of the studied fragment of SREBF1 gene in the studied groups (A). Mean values ± SEM are given as box plots: mean (horizontal line), SEM (box), SD (whiskers). * p < 0.05. Percentage of samples with at least one methylation in the SREBF1 gene. * p < 0.05 (B).

