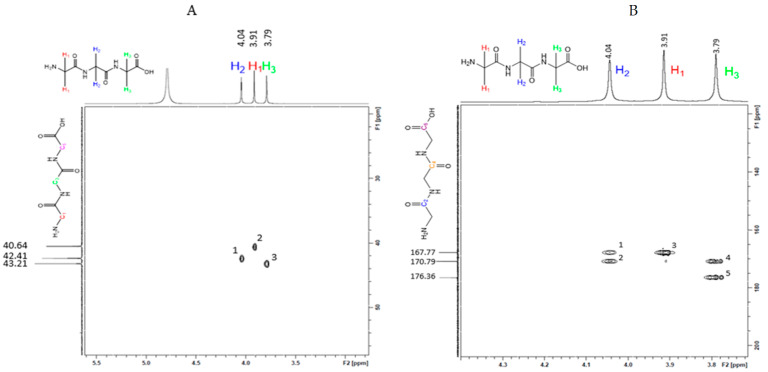
Figure 4.
2D HSQC of HG3 (A) showing a single coherence point between each proton and its corresponding carbon (1:1:1) and the 2D HMBC of HG3 (B) showing two correlation points between H2 and two carbons (C2–167.8 ppm; C4–170.8 ppm) and H3 and two carbons (C4–170.8 ppm; C6–176.4 ppm), as well as one correlation point between H1 and one carbon (2:1:2). Full spectra available in Supplemental Figure S10.

