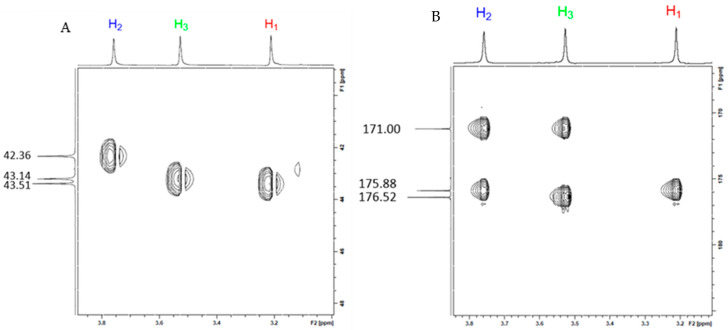
Figure 5.
2D HSQC of MgG3 (A) showing the same observable nuclei points that were observed for the free HG3 ligand and the HMBC of MgG3 (B) indicating a change in the observable nuclei pattern; the observable nuclei now show a 2:2:1 pattern, which indicates that the H1 proton is now the most upfield shifted proton. Full spectra available in Supplemental Figure S11.

