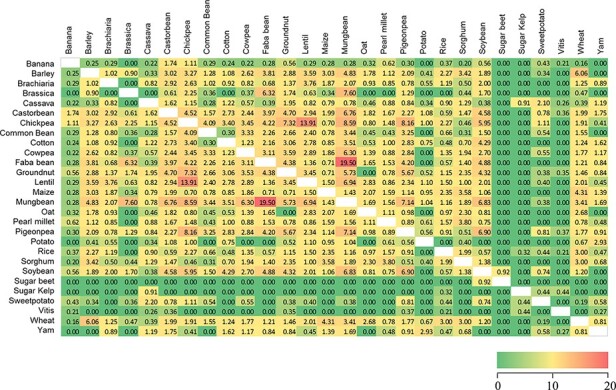
Figure 2.

Similarity heatmap for the shared trait names across 28 Trait Dictionaries (TDs) in the Crop Ontology. Values were calculated using the ‘simple matching coefficient’, colour gradient shading is relative to the pairwise percentage of trait names shared across the 28 TDs, with red indicating high values and green zero (Supplementary Table S3).
