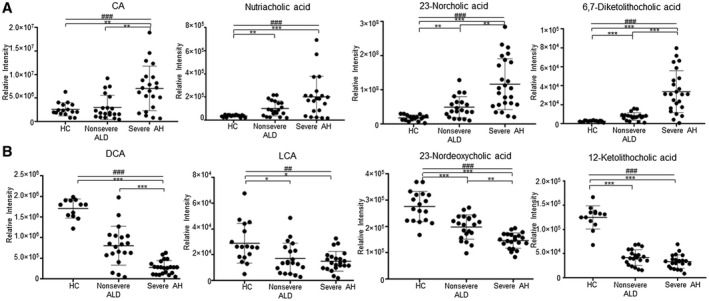
FIG. 3.

BA changes in urine among HCs, nonsevere ALD, and severe AH. (A) BAs that had increased levels with the increase in AH severity. (B) BAs that had decreased levels with the increase in AH severity. One‐way ANOVA with Bonferroni post hoc test, *P < 0.05, **P < 0.01, ***P < 0.001. P values of linear‐by‐linear association test, ##P < 0.01, ###P < 0.001. Data points represent individual patients; horizontal lines in plots show mean ± SD.
