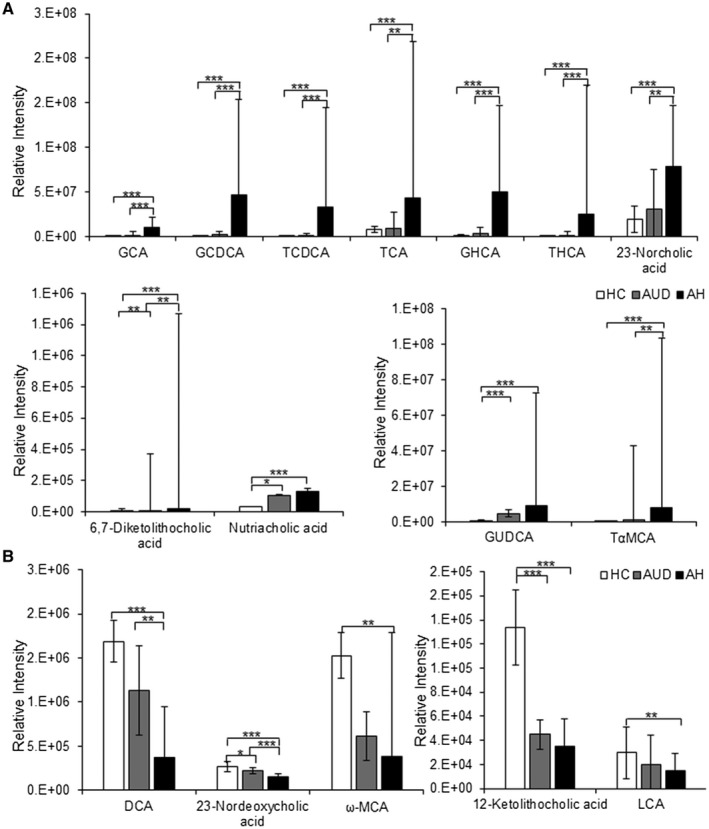
FIG. 6.

BA changes in urine collected from HCs, patients with AUD, and patients with moderate and severe AH. (A) The three panels display significantly increased levels of BAs in AH. (B) The two panels show the levels of secondary BAs were significantly decreased from HCs to AUD and to AH. Data show mean ± SD. One‐way ANOVA with Bonferroni post hoc test, *P < 0.05, **P < 0.01, ***P < 0.001.
