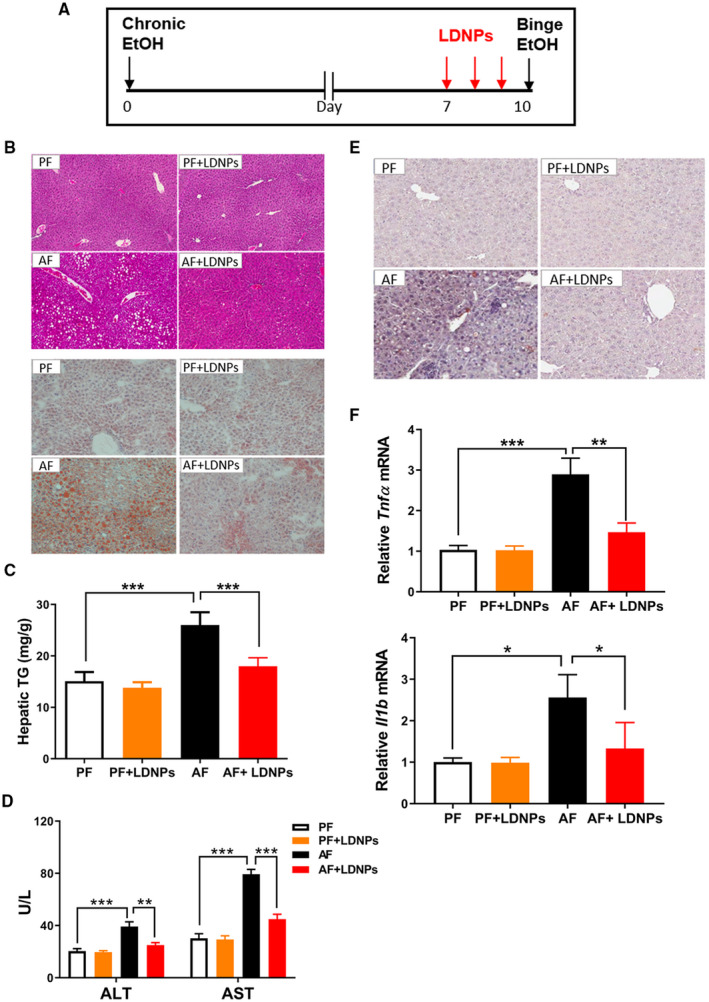
FIG. 5.

LDNPs reversed/prevented ALD. (A) Experimental design of animal treatment. (B) Representative microphotographs of H&E (upper panel) and Oil Red O (lower panel) stained mouse liver sections. (C) Hepatic triglyceride levels. (D) Serum ALT and AST levels. (E) Representative microphotographs of terminal deoxynucleotidyl transferase–mediated deoxyuridine triphosphate nick‐end labeling stained mouse liver sections. (F) Hepatic Tnf and Il‐1 mRNA expression. Data are expressed as mean ± SEM (n = 5‐7 mice/group). *P < 0.05, **P < 0.01, ***P < 0.001.
