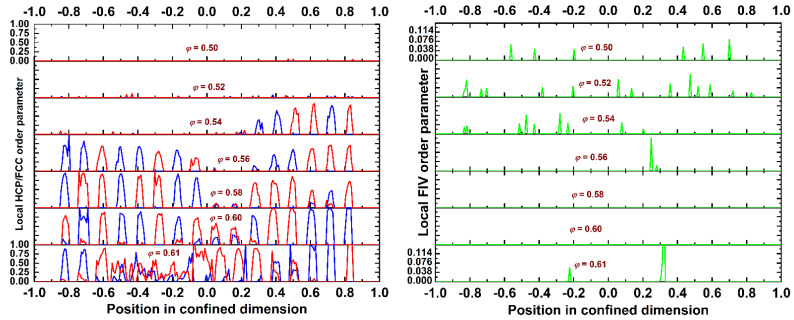
Figure 9.
Stacked plots of the local (left panel) HCP/FCC and (right panel) FIV order parameter, as calculated from the CCE norm, as a function of position in the confined dimension for the N = 100 system. Different plots correspond to different packing densities. Blue, red, and green correspond to the HCP, FCC, and FIV order parameters, respectively.

