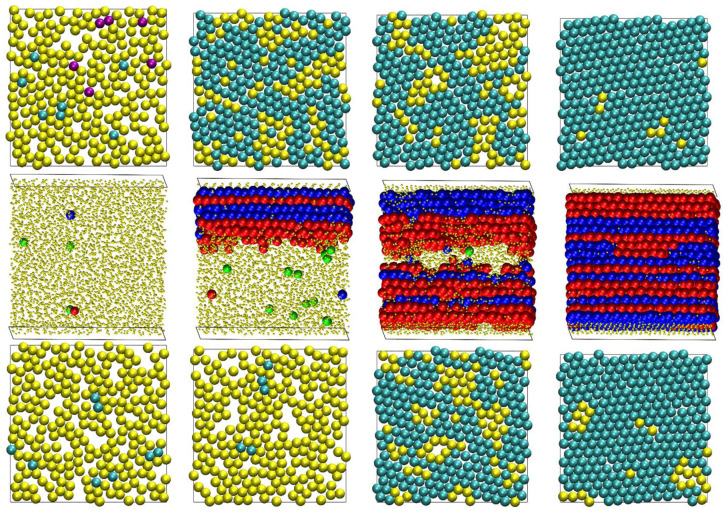
Figure 11.
Snapshots of the system configurations for the N = 100 at φ = (from left to right) 0.50, 0.54, 0.56, and 0.60 at the end of the MC simulation. The (top), (middle), and (bottom) panels correspond to the top layer, bulk volume, and bottom layer of the confined simulation cell. The atoms are colored-coded according to the crystal similarity, as identified by the CCE-norm analysis. For bulk crystallization (3-D CCE), blue, red, and green correspond to the HCP-, FCC-, and FIV-like sites, respectively. For surface crystallization (2-D CCE), cyan, purple, orange, and green correspond to the TRI-, SQU-, HON-, and PEN-like sites, respectively. The amorphous (AMO) sites are colored in yellow. In 3-D, the AMO sites are further shown with reduced dimensions (in a 1:5 ratio) for visual clarity. The figure panels are also available as 3-D, interactive images.

