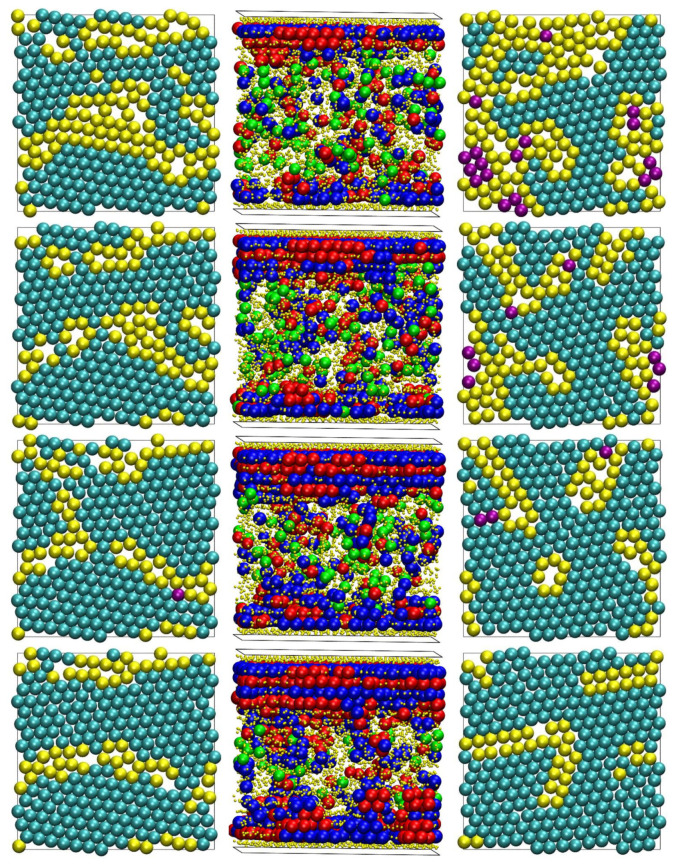
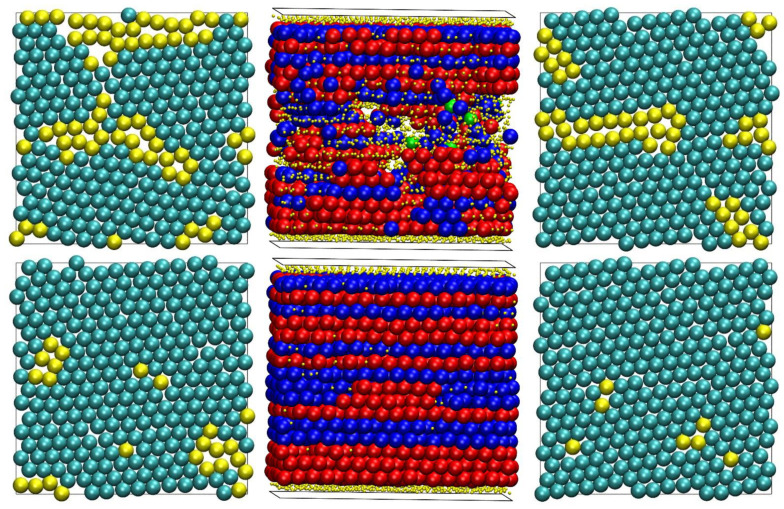
Figure 13.
Snapshots of the system configurations for the N = 100 at φ = 0.60 at various instances along the MC simulation. (Left), (middle), and (right) panels correspond to the bottom layer, bulk volume, and top layer of the confined simulation cell. From (top) to (bottom): 2 × 10⁷, 1 × 10¹¹, 2 × 10¹¹, 3 × 10¹¹, 4 × 10¹¹, and 2 × 10¹² MC steps. The atoms are colored-coded according to the crystal similarity, as identified by the CCE-norm analysis. The figure panels are also available as 3-D, interactive images.


