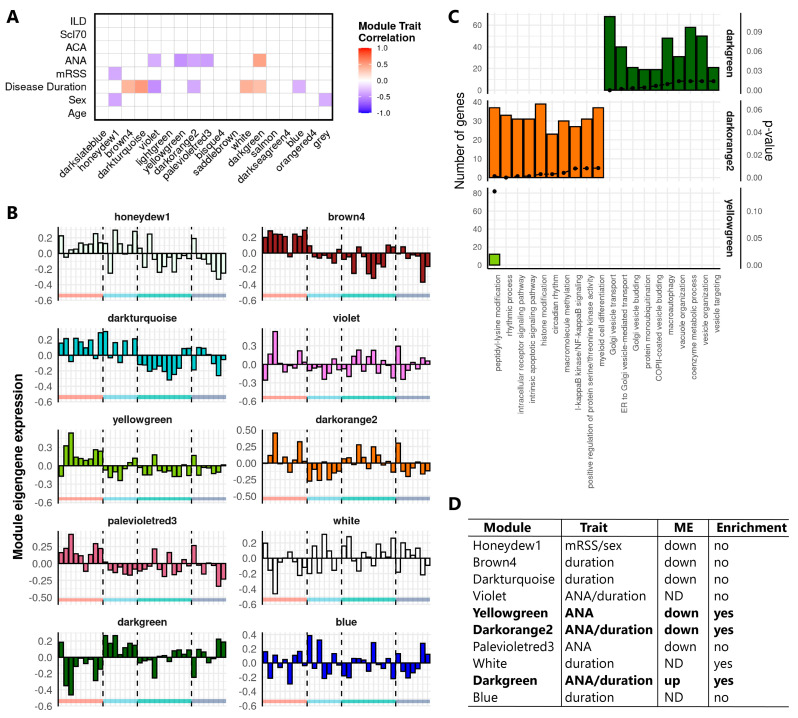
Figure 2.
Identification and functional annotation of co-expression modules correlated with clinical traits in SSc. (A) Correlation of module eigengenes (MEs) to SSc clinical traits. Rows indicate the clinical traits, and columns indicate modules identified in the Definite cohort. Cells of significant correlations (Pearson, p-value < 0.05) are color-coded by the degree and direction of the correlation (red = positive; blue = negative). Abbreviations: mRSS, modified Rodnan Skin Score; ANA, antinuclear antibodies; ACA, anticentromere antibodies; Scl70, anti-topoisomerase I antibodies; ILD, interstitial lung disease. (B) ME expression (first principal component, y-axis) of modules significantly correlated with clinical traits. Bars represent individual donors grouped according to their disease subset represented by the colors on the x-axis (red = HC, light blue = ncSSc, green = lcSSc, dark blue = dcSSc). (C) GO-term enrichment analysis of selected modules. Top 10 enriched terms for each module are shown (B&H corrected p-value < 0.05). Bars depict the number of module genes associated to enriched GO terms, and dots represent the p-value for the enrichment. (D) Table indicating the characteristics for selected modules (Column 1), considering correlations to clinical traits (Column 2), distinct ME expression pattern versus heathy controls (Column 3, up = higher ME in SSc, down = lower ME in SSc, and ND = ME not distinct from healthy subjects), and functional enrichment (Column 4). Modules that were selected for subsequent analysis are highlighted in bold.

