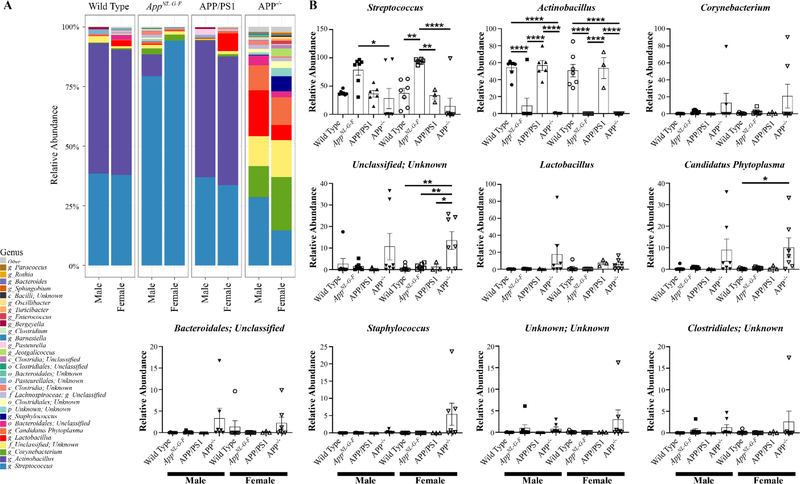
Fig. 8. Several genera differences exist in the oral microbiome between the mouse lines.
Oral swabs were taken from male and female WT, AppNL–G–F, APP/PS1, and APP−/− mice for 16S rRNA sequencing. A heat map of the relative abundance of the 30 most abundant genera. Statistical differences were calculated using one-way ANOVA with Tukey post-hoc test, *p < 0.05, **p < 0.01, ***p < 0.001, ***p < 0.0001. Data are graphed as mean values +/− SEM, n=3–7.

