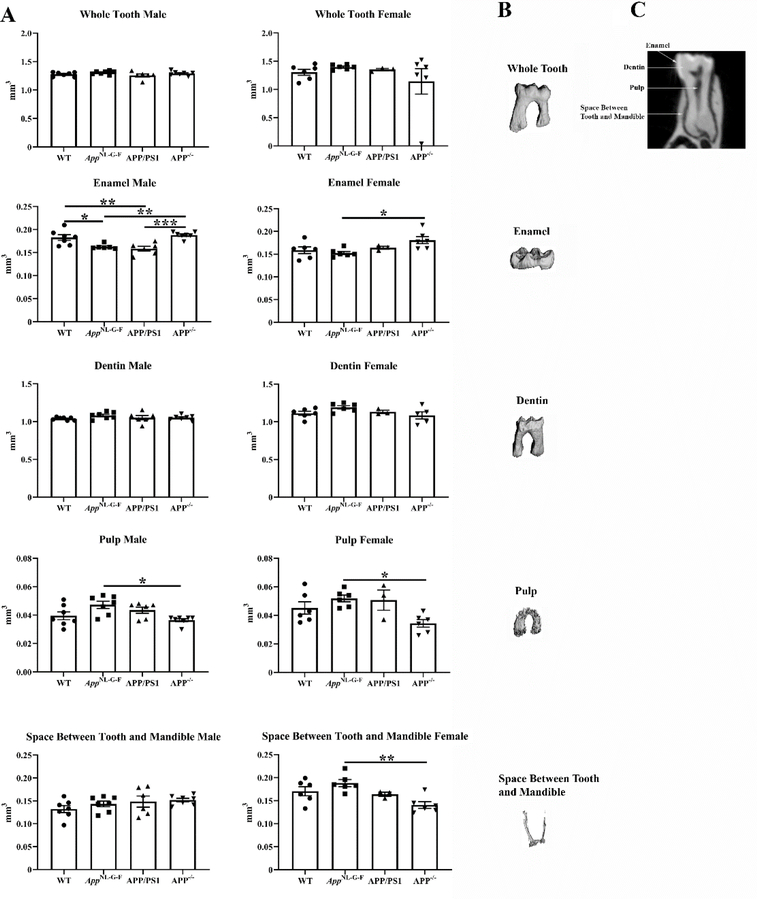
Fig. 9. Male AppNL–G–F and APP/PS1 mice had decreased tooth enamel.
The right hemimandibles from male and female WT, AppNL–G–F, APP/PS1, and APP−/− mice were scanned. The first molar from each mouse including the enamel, dentin, pulp, and the space between the tooth and mandible was contoured and analyzed. (A) Data are graphed as mean values +/− SEM, n=3–7. Statistical differences were calculated by one-way ANOVA with Tukey post-hoc analysis, *p < 0.05, **p < 0.01, ***p < 0.001. Representative images of a (B) molar and (C) discrete subregions for quantitation are shown.

