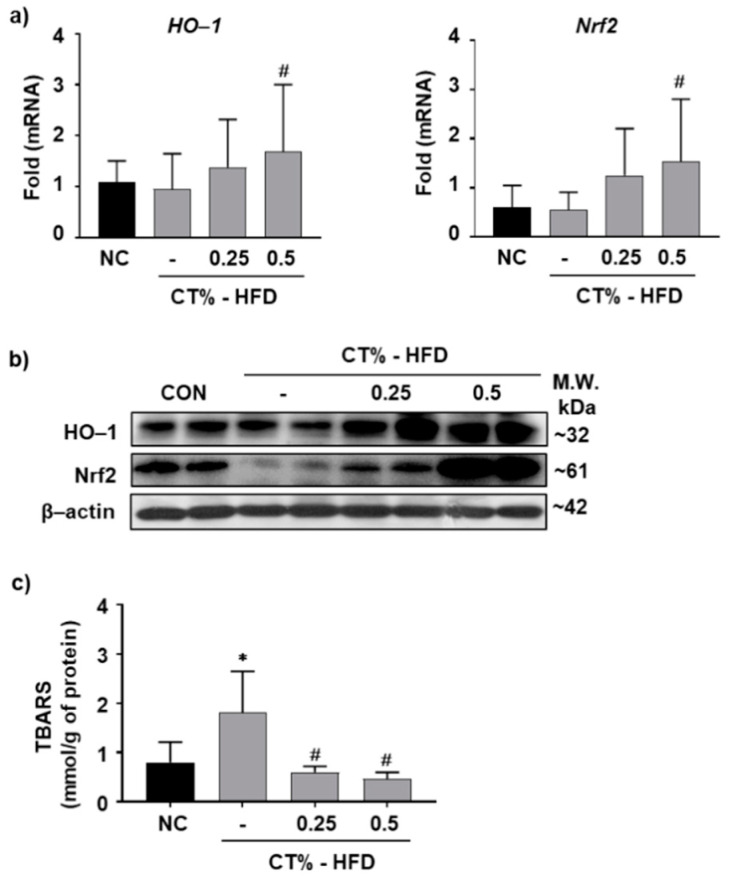
Figure 5.
Antioxidant effect of CT on HFD-fed mice. One week after acclimatization, C57BL/6J mice were fed HFD mixed with 0.25% and 0.5% CT for 7 weeks. The liver mRNA expression level of (a) heme oxygenase-1 (HO-1) and nuclear factor, erythroid 2 like 2 (Nrf2) were analyzed by RT-qPCR. (b) The protein expression levels of HO-1 and Nrf2 were estimated by western blotting and normalized to β-actin. (c) The level of thiobarbituric acid reactive substances (TBARS) were analyzed in liver lysate. NC: normal chow; (-): HFD; CT-HFD; CT treated HFD. Values are mean ± SE. AVOVA p-value: * <0.05 vs. NC group; # <0.05 vs. HFD-fed group.

