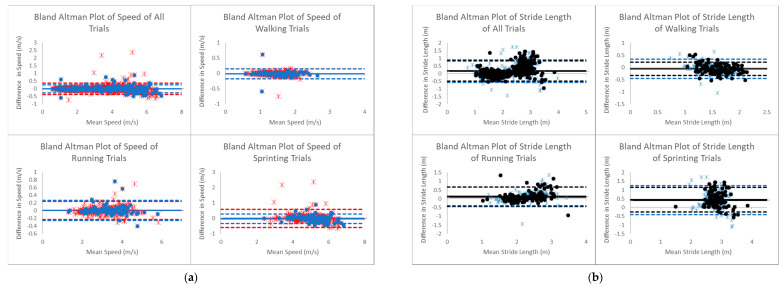
Figure 3.
(a) Bland–Altman plot of speed comparing difference (MOCAP minus ultrawide bandwidth LPS) and mean. Red stars and red dashed lines (±1.96 SD from the bias line) represent a dataset where anomalies are not removed. Dark blue dots and dark blue dashed lines represent a dataset where anomalies are removed. (b) Bland–Altman plot of stride length comparing difference (MOCAP minus ultrawide bandwidth LPS/IMU) and mean. Light blue stars and light blue dashed lines represent a dataset where anomalies are not removed. Black dots and black dashed lines represent a dataset where anomalies are removed.

