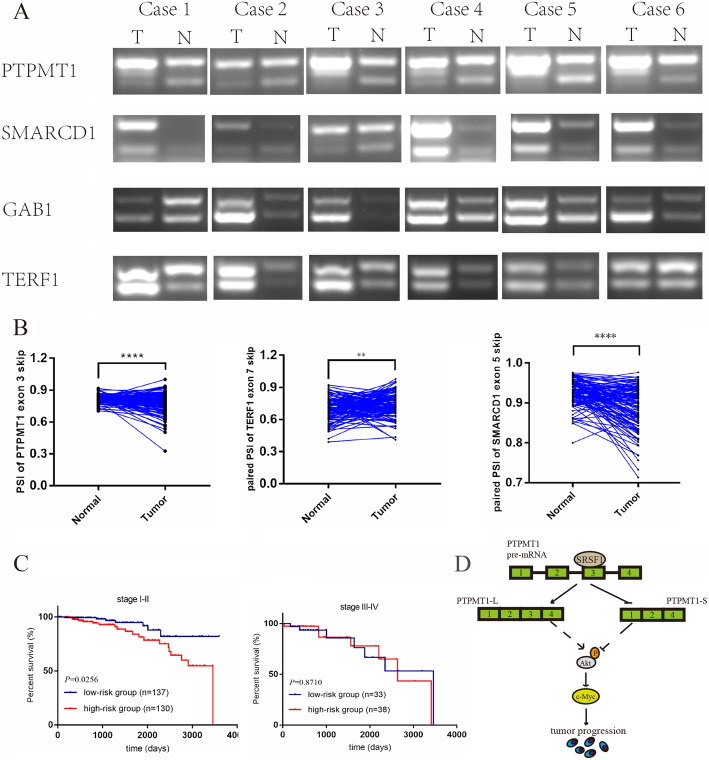
Fig. 8.
The expression patterns of representative splicing events regulated by SRSF1 in vivo and the clinical significance of splicing switching of PTPMT1. a Splicing pattern of PTPMT1/SMARCD1/GAB1/TERF1 in breast cancer and their paired adjacent tissues (n = 6) as detected by RT-PCR. b Comparison of the PSI of PTPMT1/TERF1/SMARCD1 in the 113 cancer and matched normal tissues from TCGA dataset. c Kaplan-Meier analysis of the OS of the high- (low PSI of PTPMT1 and high expression of SRSF1) and low-risk (high PSI of PTPMT1 and low expression of SRSF1) group in stage I-II or stage III-IV cohort based on TCGA data. The median of PSI of PTPMT1 or mRNA expression of SRSF1 are used as the cutoff. d The model of how SRSF1 mediates BRCA progression through modulating AS

