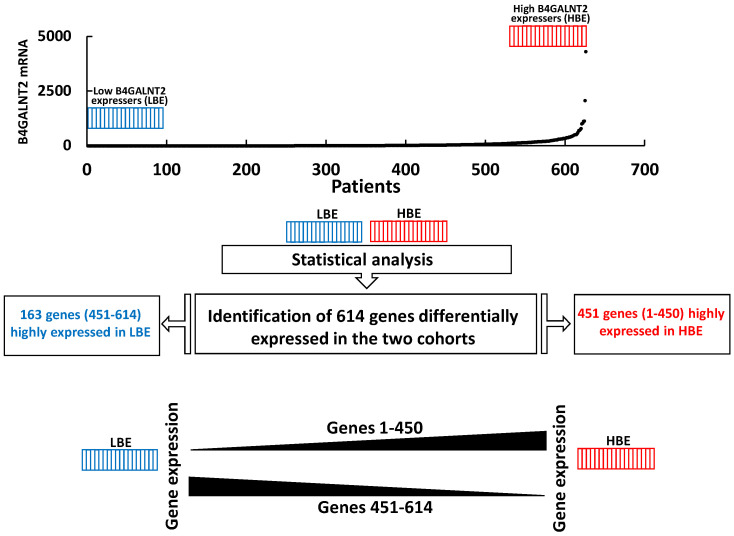
Figure 3.
Schematic representation of the TCGA data analysis. The 626 COADREAD cases were ordered according to the level of B4GALNT2 expression, differentiating the 15% top expression (HBE, red) and the 15% lower expression (LBE, blue) cohorts of 94 cases. Statistical analysis (false discovery rate two-stage linear step-up procedure of Benjamini, Krieger, and Yekutieli) revealed that 614 genes were differentially expressed in the two cohorts. Of these, 451 genes were more expressed in HBE while 163 were more expressed in the LBE.

