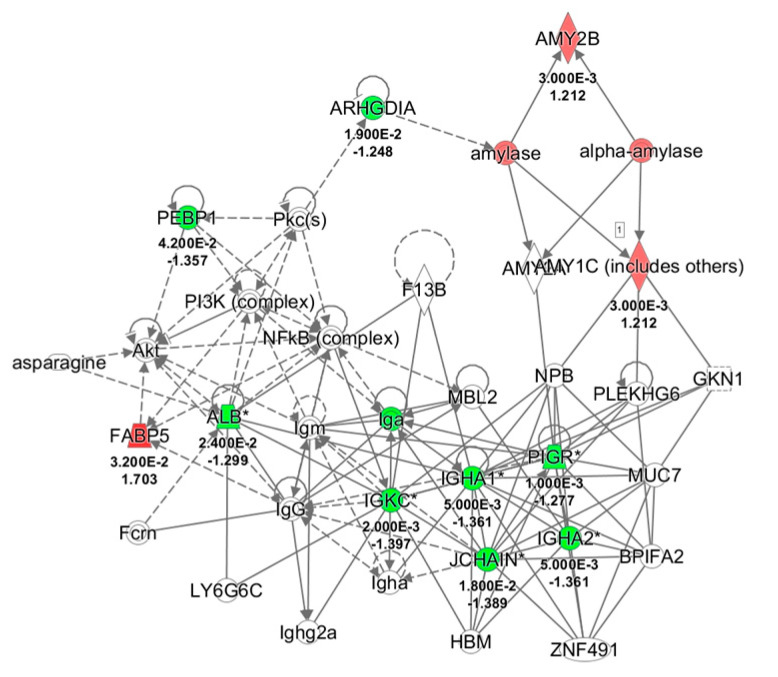
Figure 4.
Network analysis of whole saliva (WS) differentially expressed proteins obtained from T1 versus T0 comparison in odor group using Ingenuity Pathway Analysis (IPA) software. The network shows proteins interactions in the context of “Humoral Immune response and Inflammatory response” along with corresponding protein-to-protein direct (solid line) or indirect (dashed line) interactions based on published literature information. IGHA1/IGHA2, Immunoglobulin (Ig) α chain C, Iso 1, 2; PIGR, Polymeric immunoglobulin receptor; IGKC, Ig κ chain C region; SERPINB1, Leukocyte elastase inhibitor; ALB, serum albumin; JCHAIN, Immunoglobulin J chain; ARHGDIA, Rho GDP-dissociation inhibitor 1; AMY1A/1B, α-amylase, 1A/1B; FABP5, Fatty acid-binding protein, epidermal; PEBP1, Phosphatidylethanolamine-binding protein 1; Pkc, Protein kinase C; NFkB, Nuclear factor NF-kappa-B; Akt, RAC-serine/threonine-protein kinases; NPB, Neuropeptide B; GKN1, Gastrokine-1; PLEKHG6, Pleckstrin homology domain-containing family G member 6; MUC7, Mucin-7; BPIFA2, BPI fold-containing family A member 2; ZNF491, Zinc finger protein 491; HBM, Hemoglobin subunit mu; MBL2, Mannose-binding protein C; LY6G6C, Lymphocyte antigen 6 complex locus protein G6c; Fcrn, IgG receptor FcRn large subunit p51; F13B, Coagulation factor XIII B chain; PI3K, Phosphatidylinositol 3-kinase.

