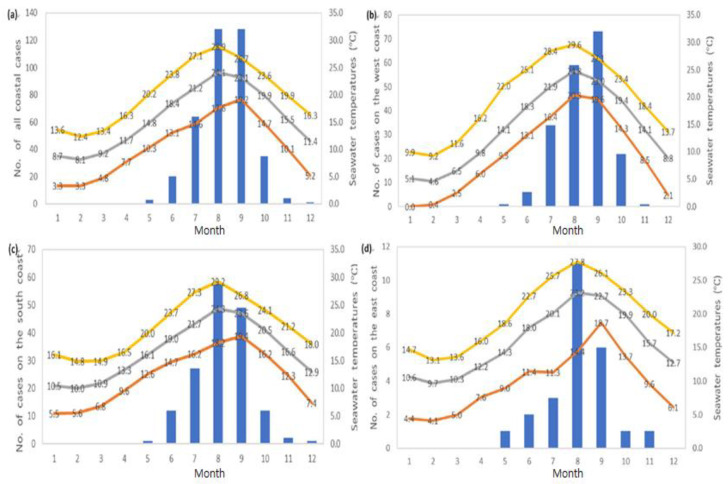
Figure 3.
Number of V. vulnificus cases and seawater temperatures by month from 2003 to 2016. (a) Total cases of all coasts, (b) west coast, (c) south coast, and (d) east coast. Blue bar represents the monthly number of cases, yellow line: maximum seawater temperature, gray line: average seawater temperature, red line: minimum seawater temperature.

