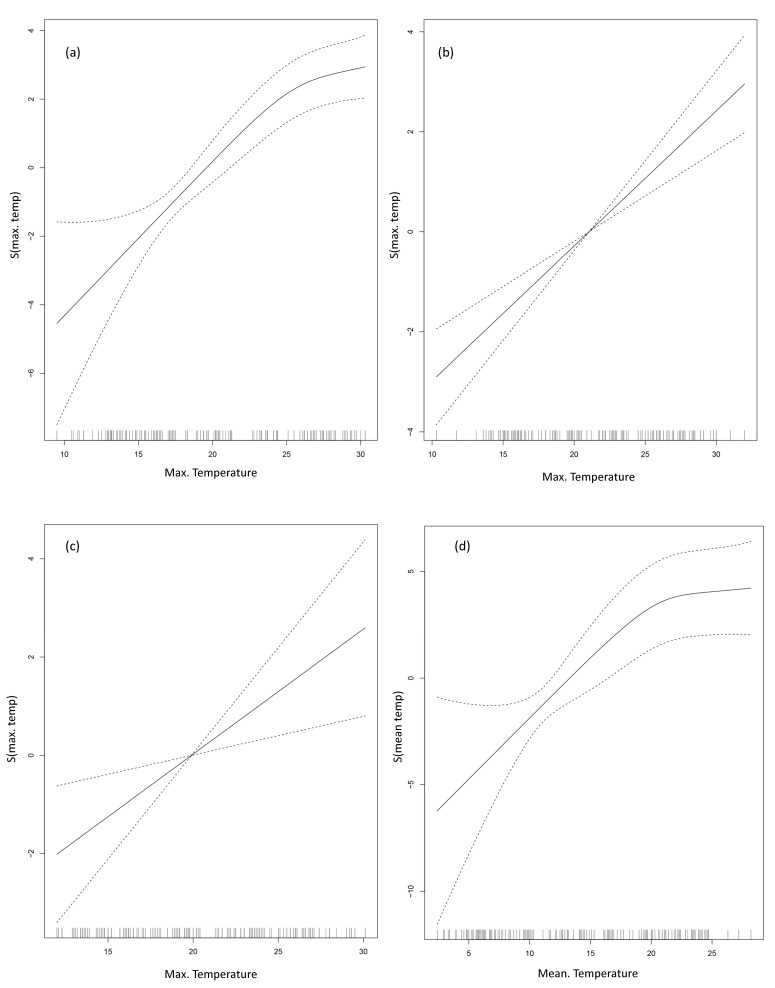
Figure 4.
Association between seawater temperature and the incidence of V. vulnificus cases on each coast (general additive model analysis). The central solid line represents central estimates, and the dashed line represents 95% confidence intervals. (a) All coasts, (b) south coast, (c) east coast, and (d) west coast.

