
Figure 2.
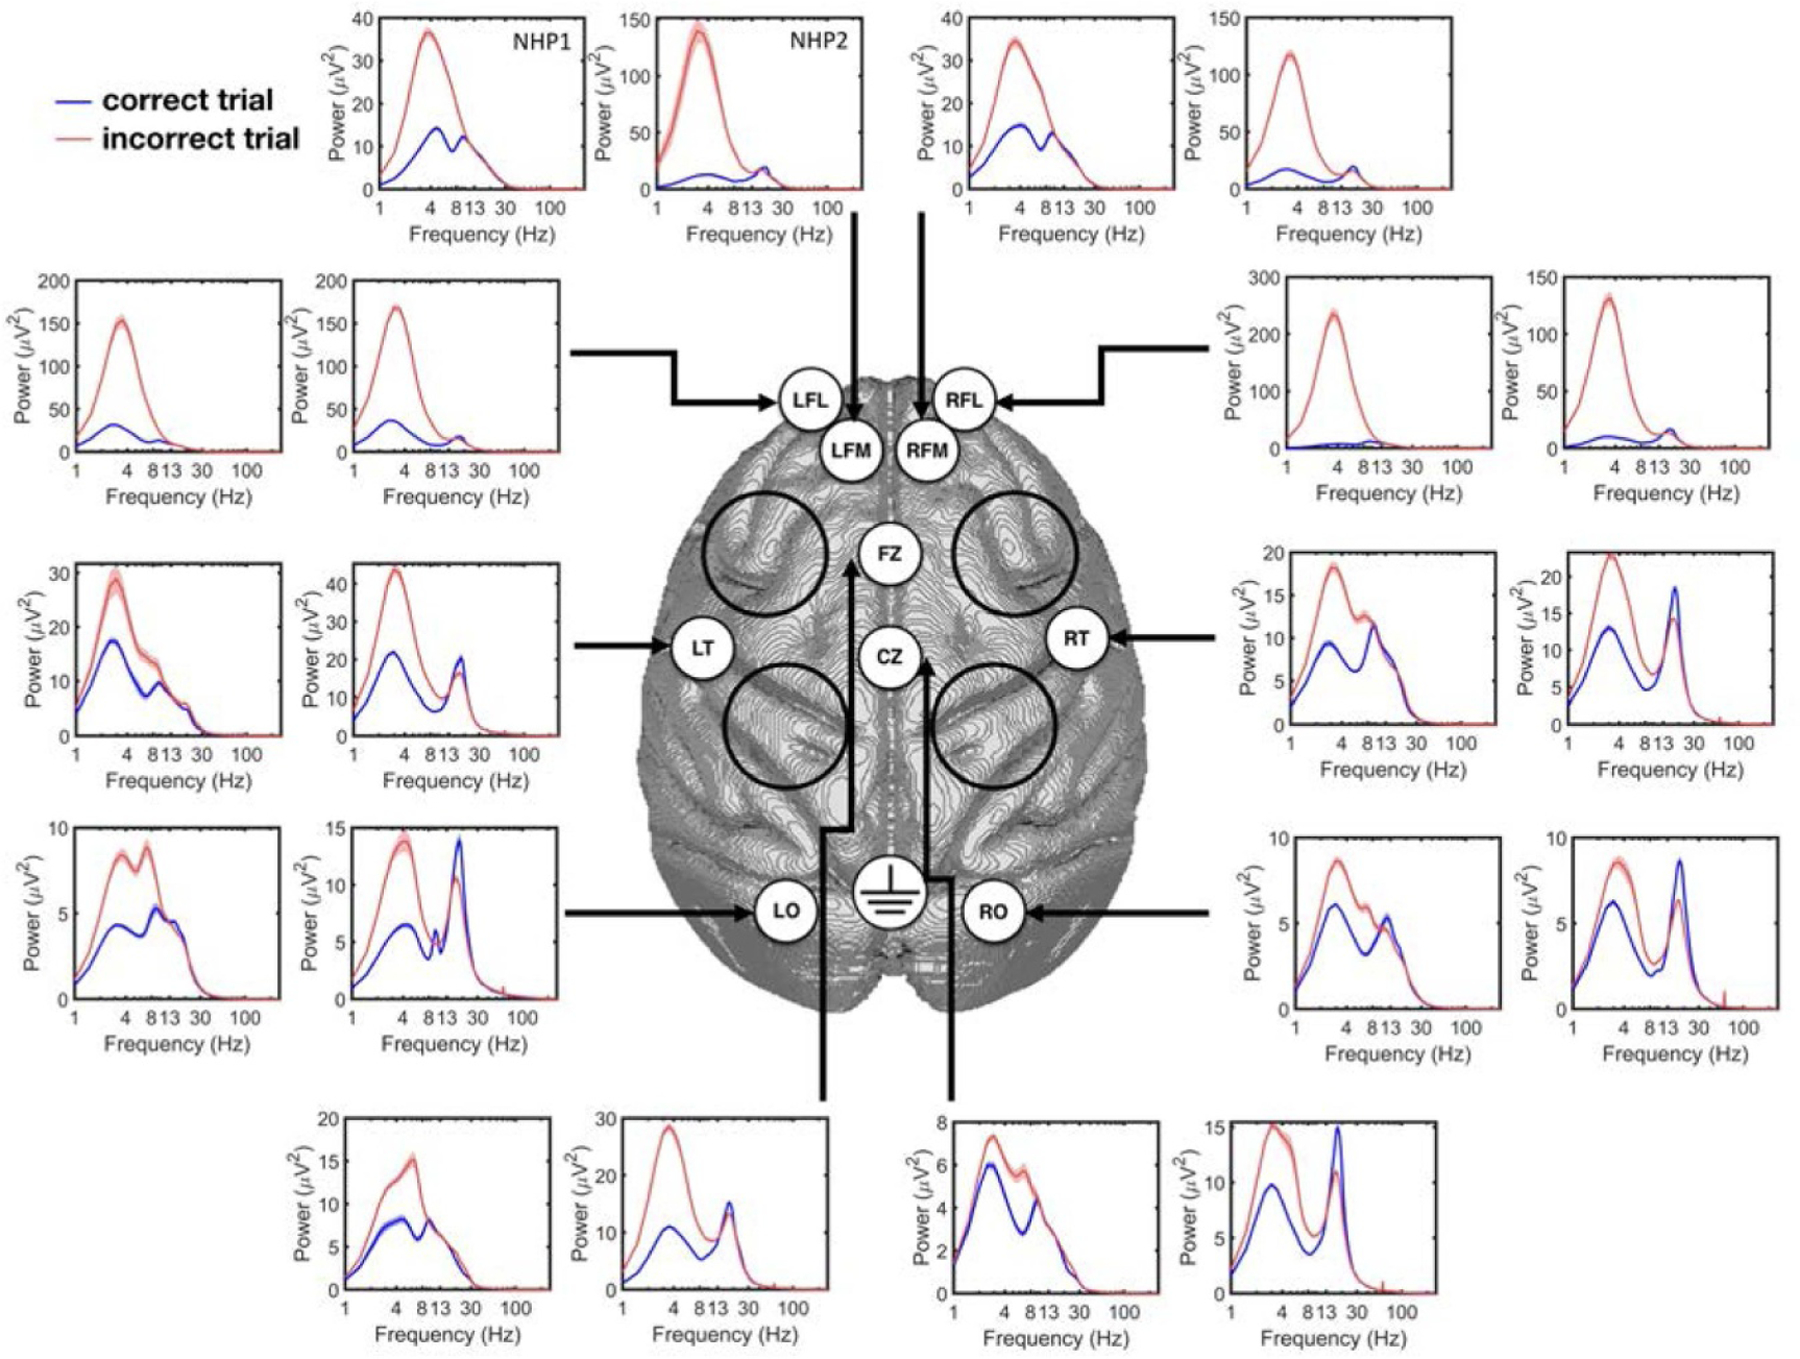
The power spectrum of correct and incorrect response trials from each ECoG channel for NHP1 and NHP2. In each subplot, the left figure corresponds to NHP1 while the right one corresponds to NPH2. Note that the range of y-axis is different between the two NHPs and on different electrodes. The black circles illustrate the locations of the cephalic chambers implanted in both animals.