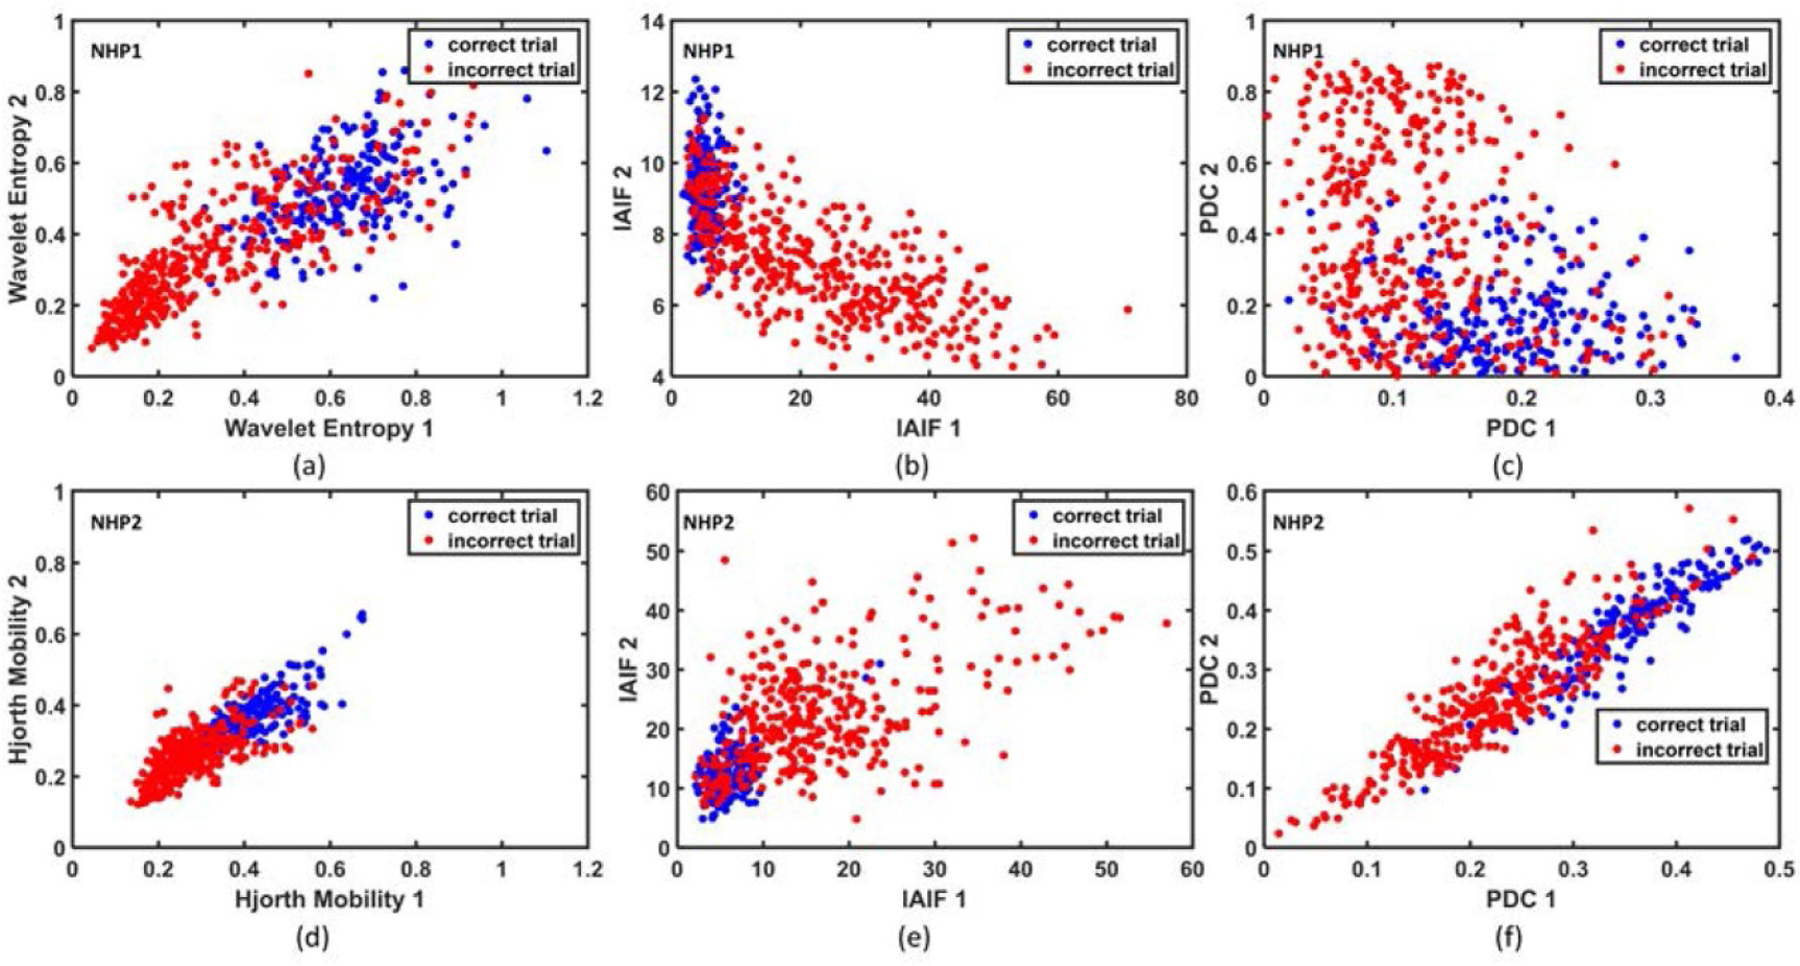
Figure 5.

Feature distribution between correct and incorrect trials showing the separability of two classes. (a) Distribution of wavelet entropy features in NHP1. (b) Distribution of IAIF features in NHP1. (c) Distribution of PDC features in NHP1. (d) Distribution of Hjorth mobility features in NHP2. (e) Distribution of IAIF features in NHP2. (f) Distribution of PDC features in NHP2. In each case, the two features that exhibit the highest R2 value with class label are used to plot the feature distribution.
