
Figure 6.
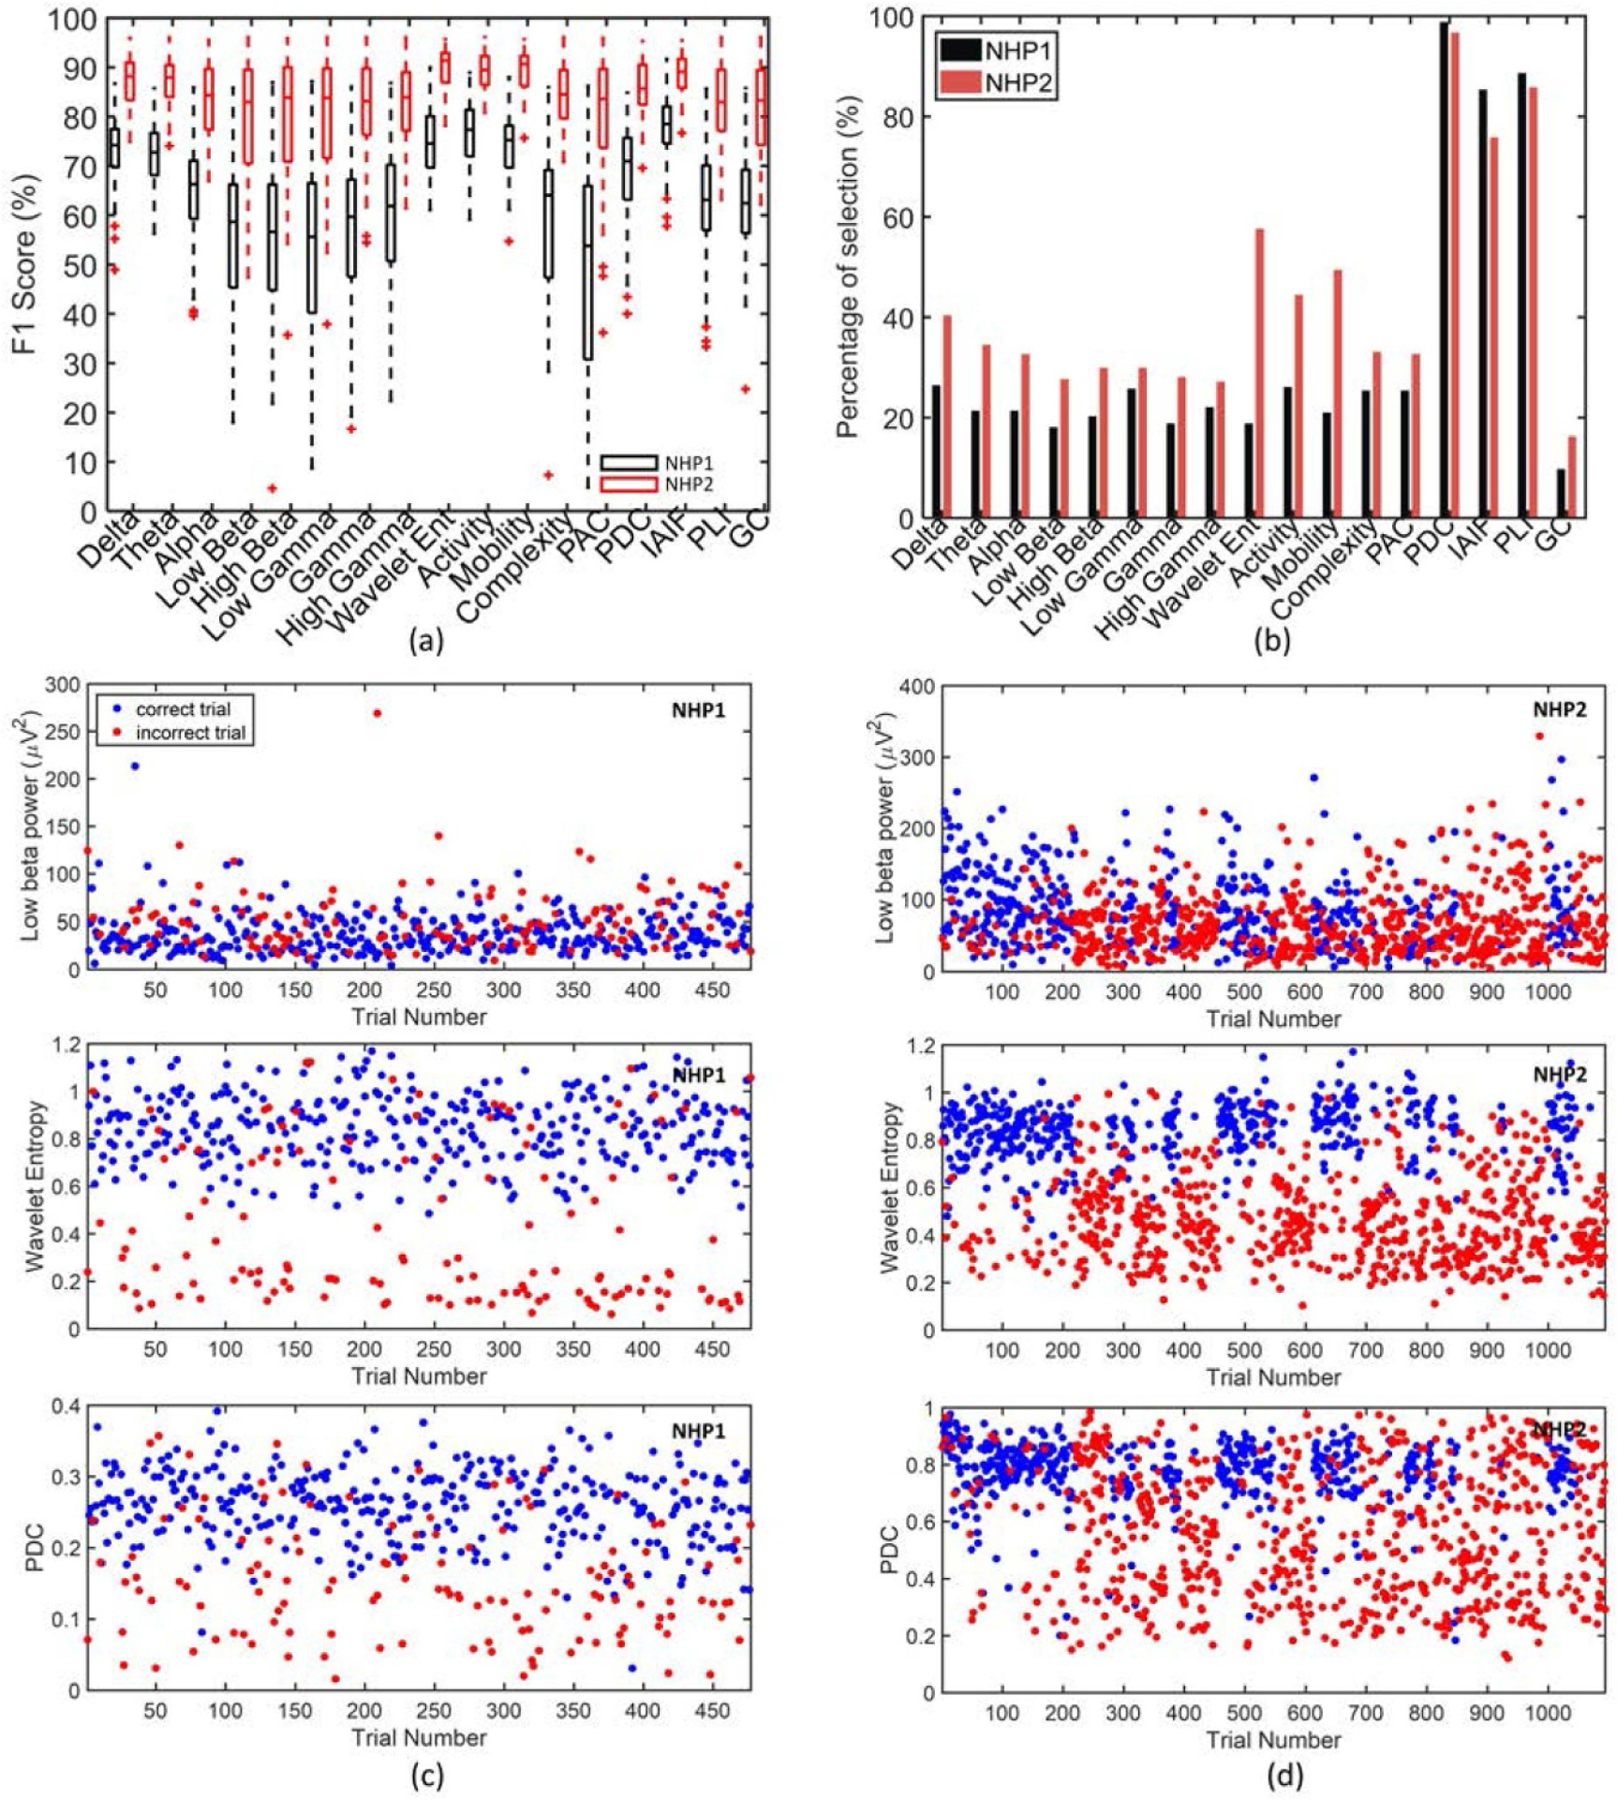
(a) The boxplot of individual feature performance, using all electrodes in NHP1 (black) and NHP2 (red). (b) The percentage of feature selection by wrapper method. If a feature was selected more than once in a session (e.g. from two different channels), it was counted as one selection. (c) The feature dynamics across trials for one session from NHP1, with the upper of the three plots corresponding to low beta power, the middle of the three plots showing the wavelet entropy, and the lower plot showing the PDC. (d) The feature changes across trials for one session from NHP2, with the upper plot corresponding to low beta power, the middle plot showing the wavelet entropy, and the bottom plot showing the PDC. For both (c) and (d), correct trials are blue and incorrect trials are red.