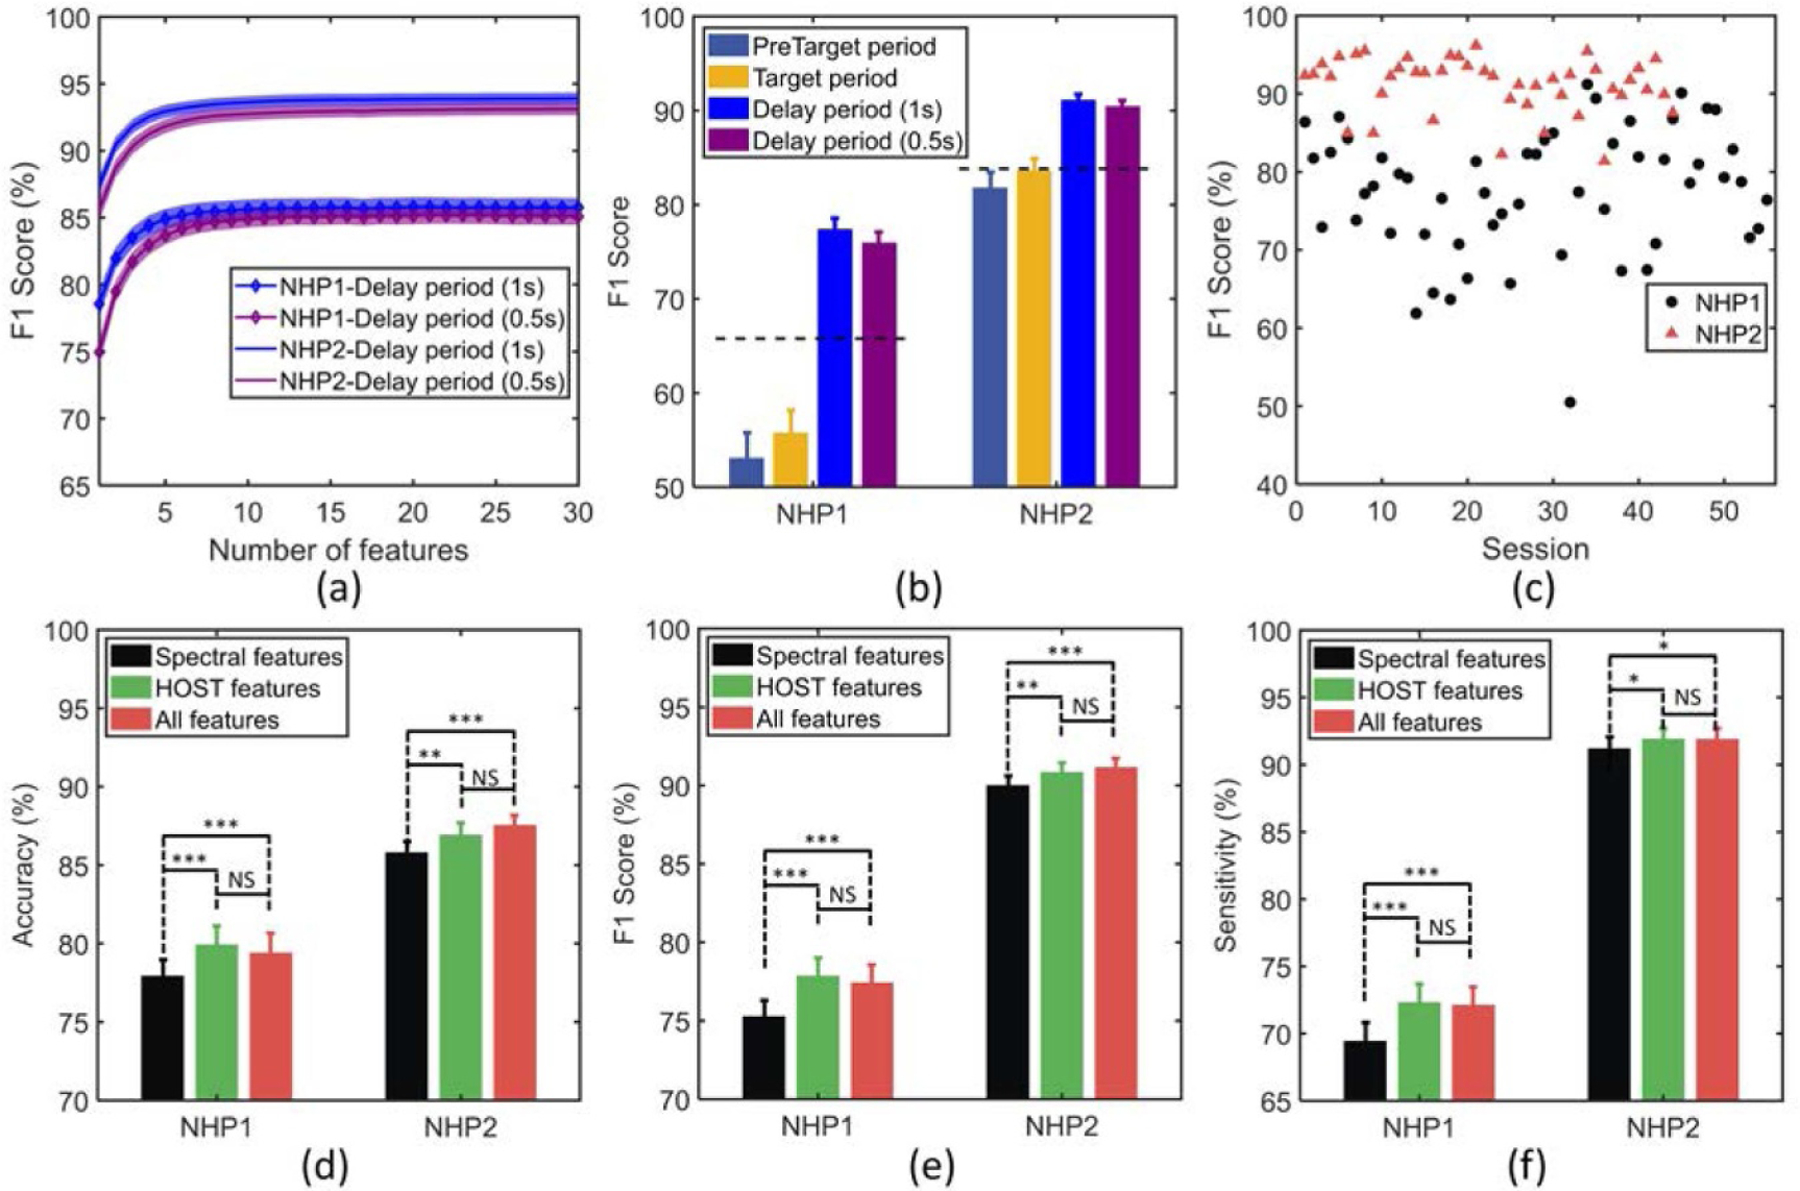
Figure 7.

(a) Training performance of the classifier during delay periods versus number of features. The most predictive features are iteratively added to the classifier using wrapper approach (the shaded area indicates the standard error over sessions). (b) Test performance of the classifier in various time periods for NHP1 and NHP2. The horizontal dashed lines indicate the baseline performance obtained by an all-positive detector for comparison (i.e. when all trials are detected as incorrect). (c) Classifier performance across sessions for NHP1 and NHP2. (d) Comparison of classification performance for spectral versus HOST features, and the combination of both feature sets. The performance was measured by metrics of accuracy (d), F1 score (e), and sensitivity (f), in both NHPs. The top performing features selected by wrapper method were used to plot (d)–(f).
Note: *** p < 0.001, ** p < 0.01, * p < 0.05, NS: non-significant.
