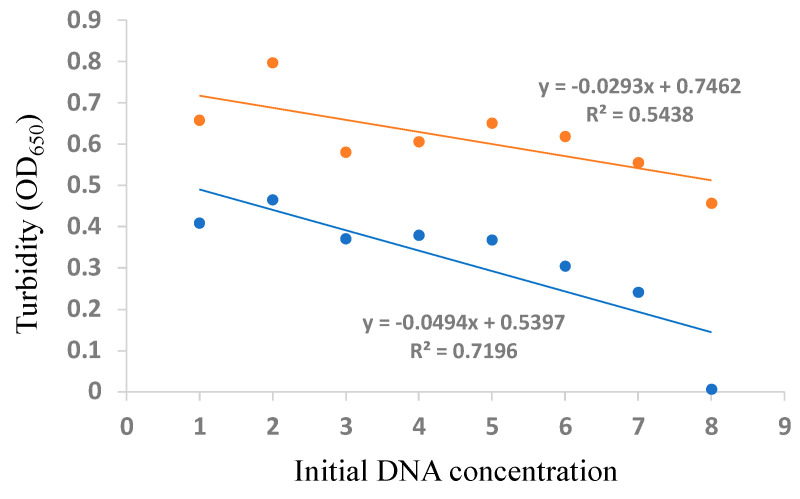
Figure 8.
Calibration Curves of Clostridium botulinum Detection Based on the Initial DNA Concentration vs. Turbidity in the LAMP Reaction at 60 min (orange dots and line) and 40 min (blue dots and line). The Initial DNA Concentrations of 1,000; 100; 10; 1; 0.1; 0.01; 0.001; and 0.0001 pg/µL are Normalized Based on “log(DNA concentration) + 5” Corresponding to Labels of 1–9, Respectively, on the x-axis.

