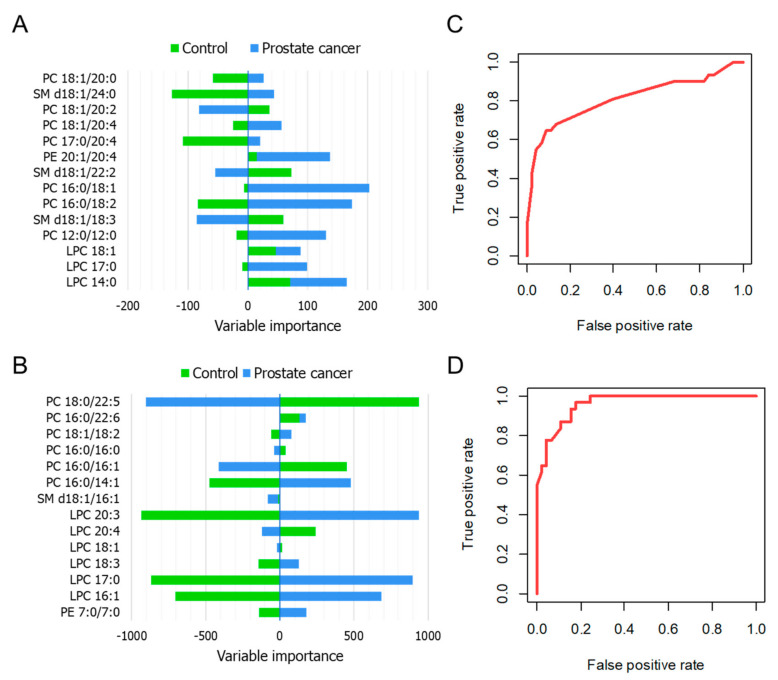
Figure 7.
ANN analysis—variable importance plot referring to the 14 most relevant features selected from the ESI-QqQ/MS (A) and MALDI-ToF/MS (B) analysis; ROC curves corresponding to the plotted probabilities calculated from the developed model for the ESI-QqQ/MS (C) and MALDI-ToF/MS (D) data, when PCa is labeled as the state variable.

