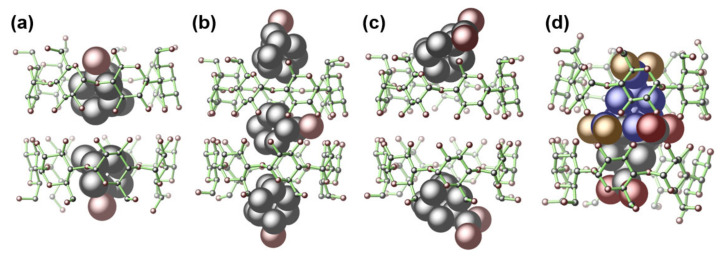
Figure 3.
The X-ray crystal structures of 1 (a), 2 (b), 4 (c), and 5 (d) showing different adamantane-to-β-CD ratios and diverse guest orientations in the inclusion complexes. The guests are presented as a space-filling model. The hydrogen atoms are omitted for clarity. Color codes: O (brown-red), C (black). For 5, the two disordered parts of adm-1,3-diCOOH are represented by blue (for C) and brown (for O), as well as gray (for black) and brown-red (for O).

